
Land UseAssessmentSurvey & CensusScenarios
How to Conduct a Site-Specific Assessment on the XNatura Platform
The XNatura platform has been designed to support two different types of environmental assessment, adaptable to your specific analysis needs: the Multi-Site Assessment, which allows for the simultaneous analysis of numerous physical assets for rapid site prioritization, and the Site-Specific Assessment, which offers a much greater level of detail on a single asset. The Site-Specific Assessment is divided into different sections, each designed to provide a comprehensive environmental evaluation of the site under analysis. In this guide, we will explore in detail the sections that make up the Site-Specific Assessment. We will discover what they are and how to navigate between them, including through demonstration videos that will guide you step by step in the exploration.
What is the Land Use section?

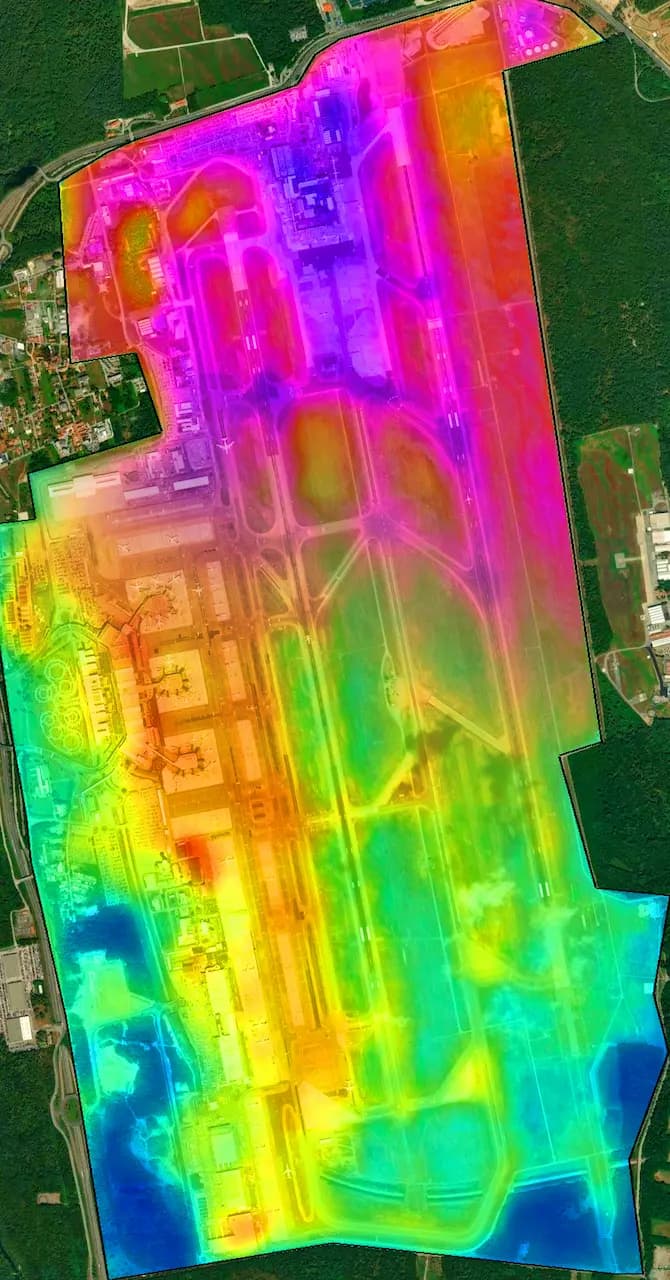
In this section, you can view on a satellite map the detail of the different types of land cover present both within your site and in the surrounding area (Control Area). Each specific type of land cover (e.g., forest, agricultural area, urban area) is associated with a quantitative estimate of local biodiversity. The key metrics analyzed are: The platform offers several exploration modes:
What is the Assessment section?

After the overview of Land Use, the Assessment section presents the detailed KPIs of your site's assessment. The environmental KPIs are obtained through a combination of advanced technologies. We use data from remote sensing and satellite images, a result of collaboration with the European Space Agency (ESA). This data is then integrated with measurements collected by IoT sensors installed directly in the field, if present in your project. The XNatura platform interface is designed to be simple and intuitive: the environmental KPIs are displayed in graphical dashboards, logically grouped by theme to facilitate analysis. As shown in the demonstration video, scrolling through the page you can sequentially view all the metrics analyzed remotely, followed by those monitored by field IoT sensors. To facilitate analysis and documentation, the platform offers the possibility to interact with the data. In dashboards marked by the appropriate icon, it is possible to manually enter a comment note on the data. A useful functionality is the support of Artificial Intelligence, which can generate an automatic comment based on simple keywords provided by the user. Finally, each dashboard ensures maximum transparency by always providing a clear legend and the data sources underlying the KPI. For reporting, the download icon allows for easy downloading of graphs or maps of interest directly from the platform. Watch the video to discover how to scroll through the platform and view the KPIs of greatest interest.
What is the Survey & Census section?

The Survey & Census section is the integration point of the XNatura platform where data collected directly in the field (analysis, sampling, and censuses) are visualized and analyzed alongside remote data. As you can see in the demonstration video, it is possible to map within the site's polygon the exact location where the analysis was conducted by manually tracing the area of interest on the map. The data that can be uploaded and visualized include: The platform facilitates the collection of biodiversity data through the mobile application Biodiversa. Any operator, even without a specific technical profile, can contribute to the census: The Survey & Census section collects images and data that provide a direct picture of local biodiversity. If the project includes the installation of camera traps, video footage of wildlife passages are also integrated. The geolocated mapping and species census are followed by the Statistics subsection, which provides key metrics for evaluating flora (and soon fauna), including:
What is the Scenarios section?

The Scenarios section is a fundamental analytical tool that allows you to compare different versions of your site. (To understand how these versions are created, consult the FAQ How to Explore Environmental Data in Your XNatura Platform Demo). These different versions of the site primarily differ in their land use and coverage. Comparing scenarios is crucial because it precisely quantifies the impact of such differences on key environmental parameters. Among these parameters, we find the mean species abundance (MSA), the degree of naturalness, and soil impermeability. The platform displays the variation of parameters between the two scenarios both in absolute value and in delta (the quantitative difference). Besides comparison, the Scenarios section also allows you to monitor the evolution of each scenario over time, thus providing a dynamic perspective for planning and evaluating interventions.
What is the Risks and Opportunities section?

The Risks and Opportunities section represents the final and crucial phase of the Site-Specific Assessment, offering a forward-looking and strategic view on the future of your asset. Its main goal is to map and quantify the potential risks that persist on each version and perimeter of the site created on the platform. To provide a comprehensive and predictive assessment, the analysis measures these risks over an extended time horizon, projecting out to 2100. The calculation is based on established scientific methodologies, using four different scenarios defined by the IPCC (Intergovernmental Panel on Climate Change), allowing an understanding of the potential impact under various future climate trajectories. The user can consult the overall risk of the asset or explore the data broken down into six specific risk factors: climate, water, pollution, biodiversity, geological risk, and marine risk (where applicable). For each of these factors, the platform evaluates in detail the different aspects of risk. A particularly important functionality is the ability to visualize the trend of risk over time for the following fundamental categories related to the physical impacts of climate change: Climate Change, Wind, Heat Waves, Cold Waves, Precipitation and changes in their patterns, Fires, Thermal stress, Extreme heat, and Extreme storms. Finally, if the asset under analysis is assigned an economic value, the platform is also able to assess the resulting economic impact of the risk, thereby supporting long-term strategic and financial decisions.
Companies that have chosen XNatura
A35 BrebemiIlaria Napoli - Sustainability Manager
We are monitoring the impact of our assets on biodiversity, improving it through regeneration efforts such as the creation of our Oases, and increasing our impact by raising awareness among local students.
Read more
Argor HeraeusAngelo Rizzella - Sustainability Manager
With XNatura we are able to assess the impact of our clients, such as mines, on local ecosystems, understanding the levels of biodiversity degradation.

Parco delle Groane e della Brughiera Briantea
We are proud and happy to lead this important project as Parco delle Groane e della Brughiera Briantea, which once again sees us collaborating with leading Italian universities and organizations that have long been active in our region. Biodiversity is essential for our planet, and its loss is one of the most urgent emergencies we must address today.
Read more
Cassa Centrale
Together with XNatura we are protecting and monitoring biodiversity through the Oases of the Cassa Centrale - Credito Cooperativo Italiano Group, where our goal is to promote projects that protect the natural environment and biodiversity.
Read more
Harting
Through our collaboration with XNatura, we have deployed technological solutions to foster respect for nature and the ecosystem, creating sustainable value for future generations.

Mutti
The issue of biodiversity has always been central to the strategies of Mutti, whose business revolves entirely around a product of the earth, a symbol of Made in Italy in the world: the tomato. Precisely for this reason, within our Green Strategy, we have initiated a program of ecosystem restoration and rehabilitation, which starts from the very land where we have our production facilities. The collaboration with XNatura is therefore essential for us, in order to give scientific validation to our projects and help us in building a long-term strategy that will help us grow and bring increasing value to the environment.
Read more
FoxyResponsabile Marketing e Comunicazione
We are proud to work alongside XNatura's 3Bee project to monitor and regenerate biodiversity in Europe. We started by monitoring honeybees and are expanding the project to regeneration. Through communication on Foxy Love the Bee products and to consumers, we can help spread this awareness and do our part for a more sustainable planet.
Read more
FindusInes Teixeira - Head of Marketing Veg Southern Europe
With XNatura, we are monitoring about 1.000 hectares of our supply chain aiming to understand the level of biodiversity and its relationship with our farms.

Leone AlatoIgor Boccardo - CEO
We decided to give priority to the natural capital of the Group by monitoring 16k ha. We are developing a long-term strategy to enhance the ecosystem services of our assets in collaboration with Generali Country Sustainability & Social Responsibility.
Read more
Cherry BankMaddalena Ganz - Responsabile Marketing e Comunicazione
Respect is one of the core values of Cherry Bank's governance. This world is what we all have in common. Creativity, sensitivity, and innovation are needed to find a balance between new needs and respect for Nature's resources. It’s not the trees that will save the planet, but humankind.
Read more
CubicoDavide Romano - Head of Operations
We are deeply committed to protecting biodiversity and integrating sustainability into our projects. Our initiatives support wildlife, agriculture, and regenerative efforts, to create long-term impacts for a more sustainable future.
Read moreDiscover XNatura
XNatura focuses on the digitalization of nature, integrating artificial intelligence, IoT sensors, satellite technologies, and cloud computing. The goal is to collect, process, and analyze environmental data to support companies, public entities, and natural parks in monitoring and managing risks and impacts on nature, biodiversity, and climate change.
Data Analytics
AI Nature Specialist
IoT & Nature
Satellite Map Specialists
Do you have any doubts or questions?
Book 30 minutes
 Contact us for information about the platform or for specialized consulting in the environmental field.
Contact us for an environmental consultationContact us for information about the platform or for specialized consulting in the environmental field.