Back to KPI list Built-Up Surface
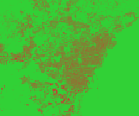 Built-Up Surface
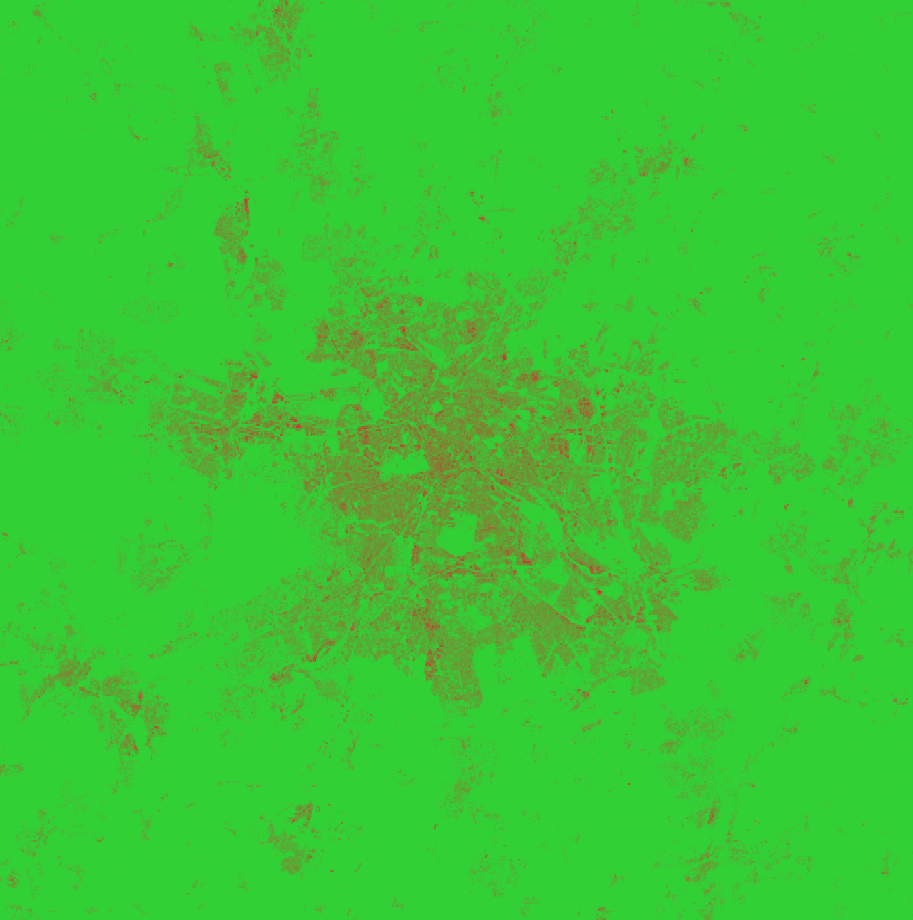 Built-Up Surface
 Built-Up Surface
Built-Up Surface
Urbanizationvv1
Responsible:Niccolò Calandri
Layer Built-Up Surface on real sites
Real Estate UK
Catania
Berlino Quarter
Mina el Cerrejon
Built-Up Surface
Overview
Built-up surface is the amount of land covered by buildings, roads, and other human infrastructure. It provides information on anthropogenic pressure on the environment and natural habitat loss. A high built-up surface indicates intense urbanisation that fragments the territory, reduces soil permeability and limits habitat availability for wildlife and flora.
Urbanisation is one of the leading causes of biodiversity loss globally (Seto et al., 2011). Monitoring built-up surface over time allows identification of areas subject to growing development pressure and evaluation of the effectiveness of land consumption containment policies.
Calculation Methodology
Built-up surface indicates the percentage of land covered by buildings, roads and infrastructure. The calculation is based on:
- Data source — GHSL Built-Up Surface (Global Human Settlement Layer), produced by the JRC (Joint Research Centre) of the European Commission
- Resolution: 10 m
- Temporal coverage: 1975–2030
- Value computation — mean of GHSL raster pixels within the study area, representing the fraction of land covered by built infrastructure
- Historical calibration — historical trends are calibrated to align with the percentage derived from Land Cover in the year 2025, ensuring consistency between different sources
- Output — built-up surface percentage (
busf) over the total polygon area
Unit: percentage (%)
Data Sources
| Code | Name | Provider | Resolution | Availability |
|---|---|---|---|---|
WRD_GHBLT_99 | GHSL Built-Up Surface | JRC — European Commission | 10 m | 1975 — 2030 |
GHSL is the global reference dataset for monitoring human settlement, with historical series enabling urbanisation trend analysis.
Quality Range and Levels
| Indicator | Unit | Range | Inverted |
|---|---|---|---|
busf | % | [0, 20, 40, 60, 80, 100] | Yes |
Inverted = Yes: for this indicator, a lower value is better, as it indicates less artificial coverage and greater naturalness of the territory.
| Level | busf | Interpretation |
|---|---|---|
| E | 80 – 100 % | Extreme urbanisation — habitat almost completely absent |
| D | 60 – 80 % | High urbanisation — habitat heavily reduced |
| C | 40 – 60 % | Moderate urbanisation — fragmented habitat |
| B | 20 – 40 % | Low urbanisation — good habitat availability |
| A | 0 – 20 % | Minimal urbanisation — predominantly natural habitat |
Version History
| Version | Change Description |
|---|---|
| v0 | First version |
| v1 (current) | Historical trend calibration against Land Cover 2025 percentage |
Technical Notes
- Built-Up Surface maps must be generated before computation
- Historical trends (1975–2020) are calibrated to align with the 2025 Land Cover value
- GHSL includes residential and industrial buildings, road and rail infrastructure
References
- Pesaresi, M. et al. (2024). "Advances on the Global Human Settlement Layer by Joint Data Fusion". International Journal of Digital Earth, 17(1).
- Seto, K.C., Güneralp, B., Hutyra, L.R. (2011). "A meta-analysis of global urban land expansion". PLOS ONE, 6(8), e23777.
Quality Ranges and Levels
busf
(%)ACritical
BLow
CModerate
DGood
EExcellent
0 → 19.99
20 → 39.99
40 → 59.99
60 → 79.99
80 → 100
A
Critical0 – 19.99B
Low20 – 39.99C
Moderate40 – 59.99D
Good60 – 79.99E
Excellent80 – 100Data Sources & References
Sources
WRD_GHBLT_99
Methodology
Built-up surface indicates the percentage of land covered by buildings, roads and infrastructure. Source: GHSL Built-Up Surface (JRC, 10 m, 1975–2030). The value is the mean of GHSL raster pixels within the study area. Historical trends are calibrated to align with the Land Cover percentage in 2025. Inverted indicator: lower values indicate lower anthropogenic pressure.