KPI Documentation
Technical documentation for environmental indicators used in the ILoveNatura platform
181 indicators found
Maps
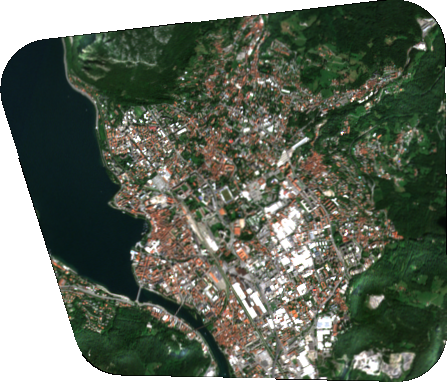
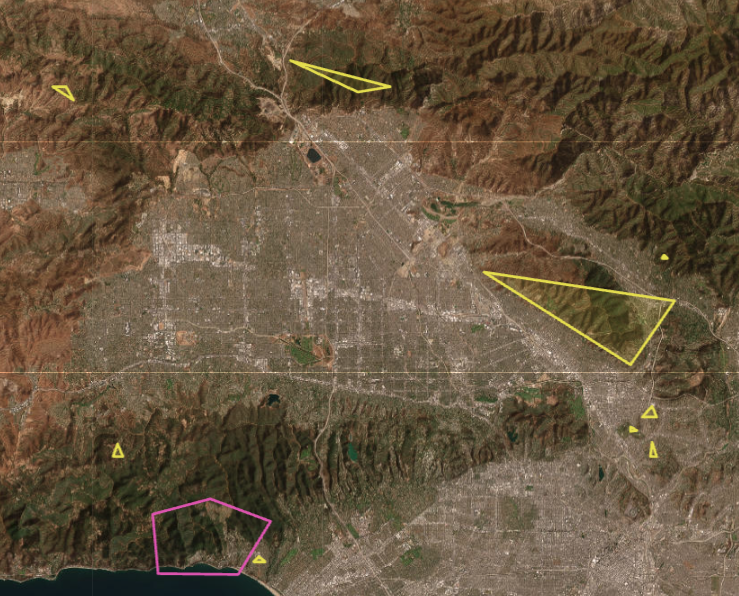
RGB satellite imagery
RGB satellite imagery
rgbDocumentation
Maps
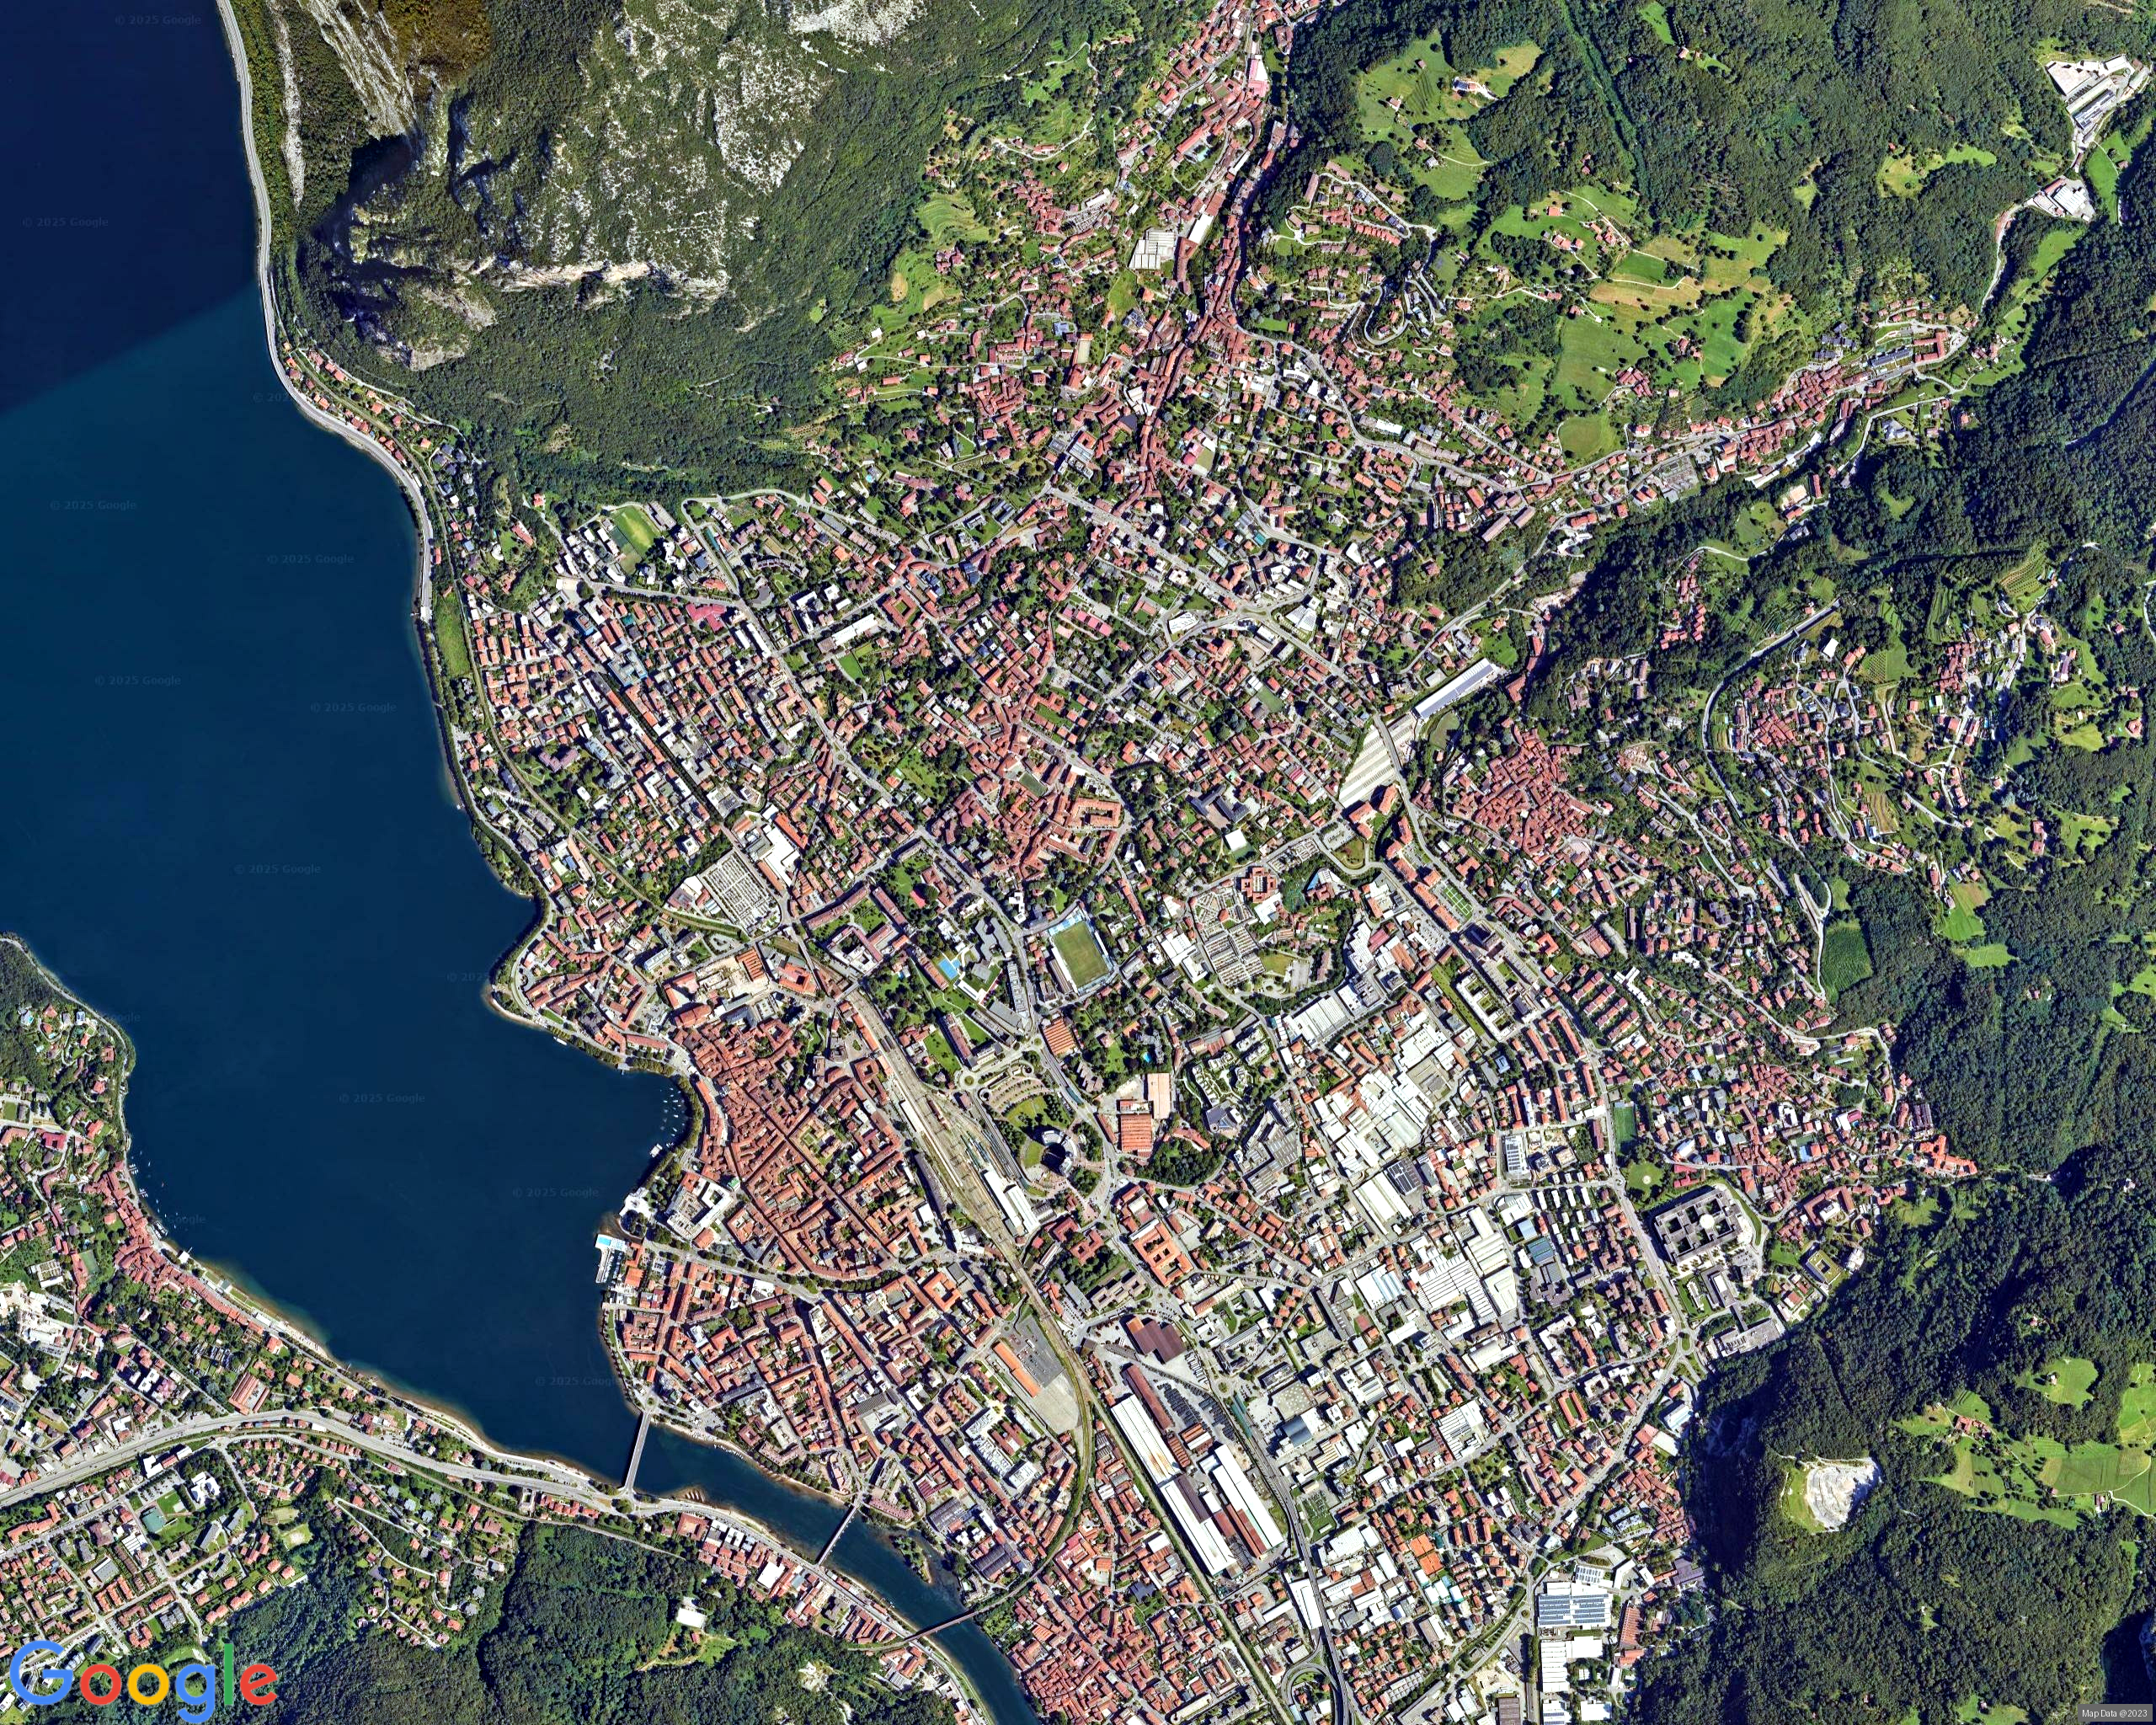
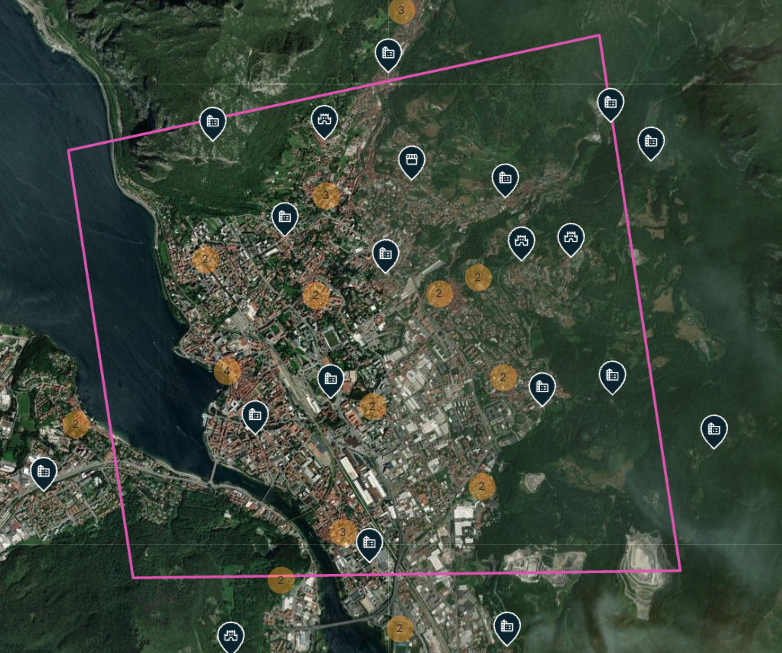
High resolution RGB imagery
High resolution RGB imagery
rgb_high_resDocumentation
Maps
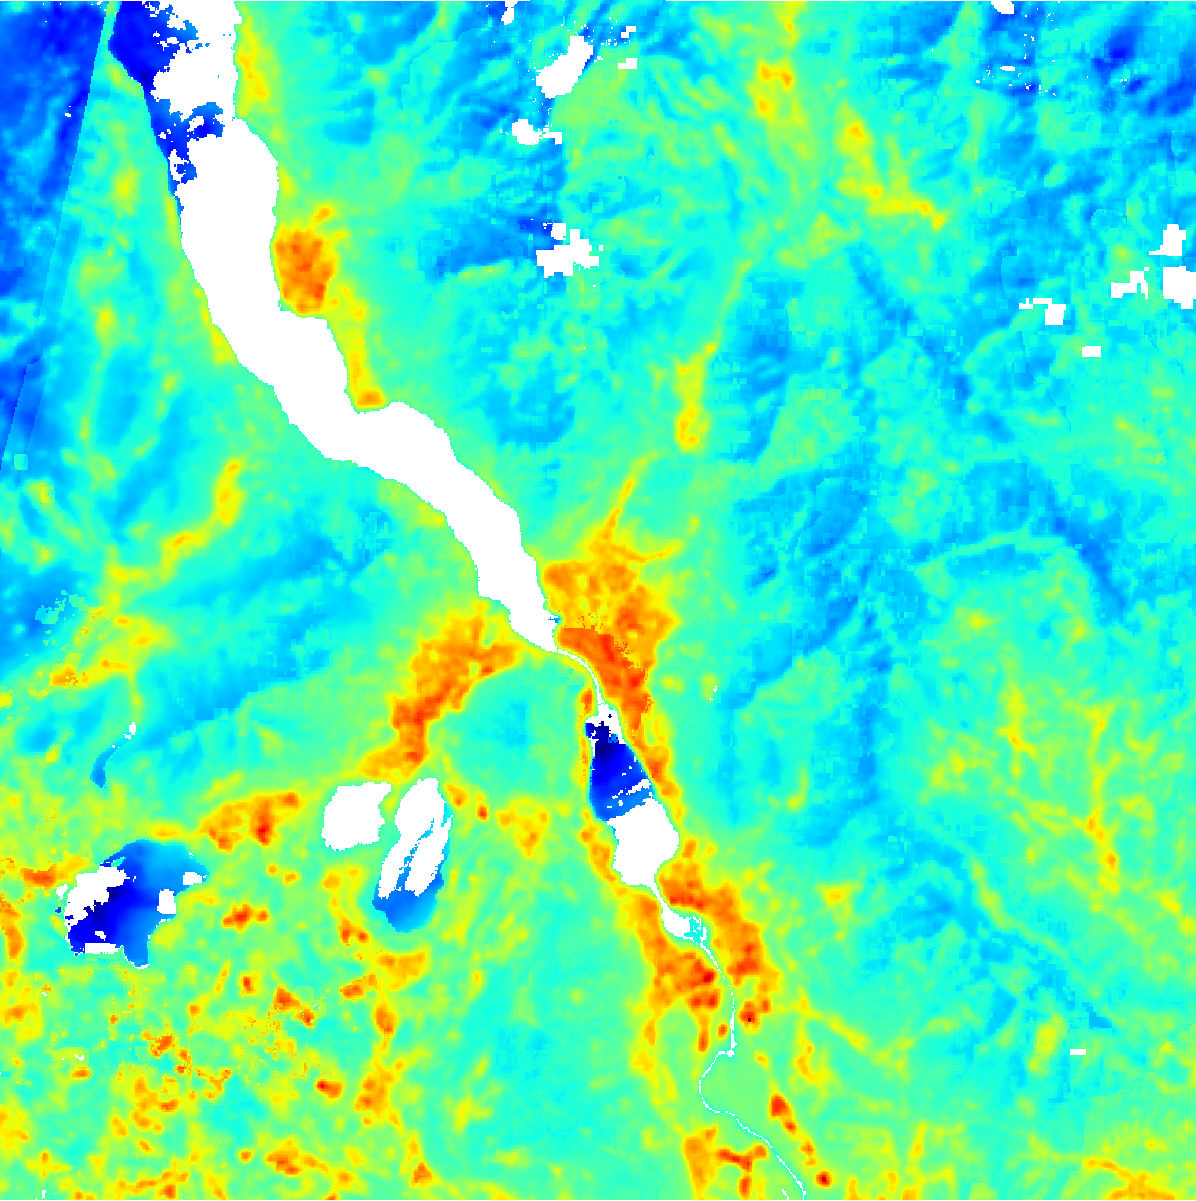
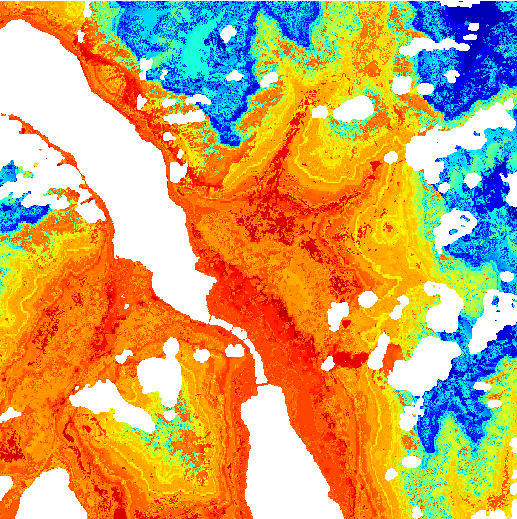
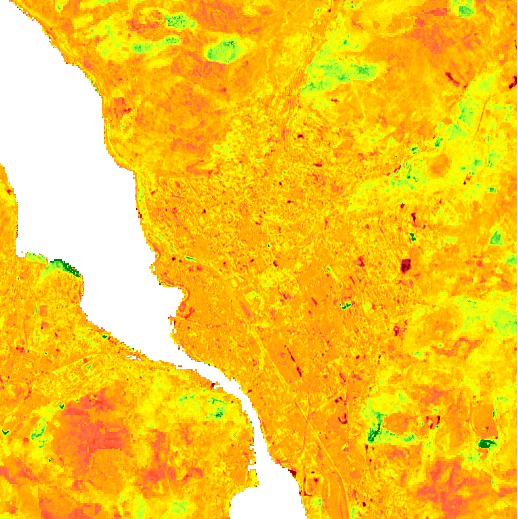
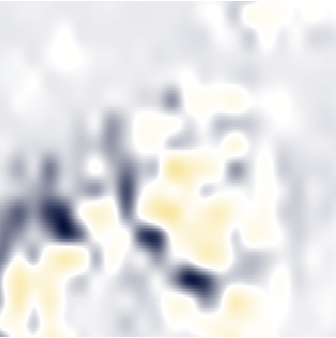
Land Surface Temperature
Land Surface Temperature
lstDocumentation
Maps
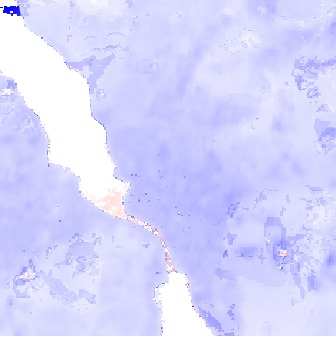
LST annual range
LST annual range
lst_rangeDocumentation
Maps
LST range delta between years
LST range delta between years
lst_range_deltaDocumentation
Maps
Night Land Surface Temperature
Night Land Surface Temperature
night_lstDocumentation
Maps
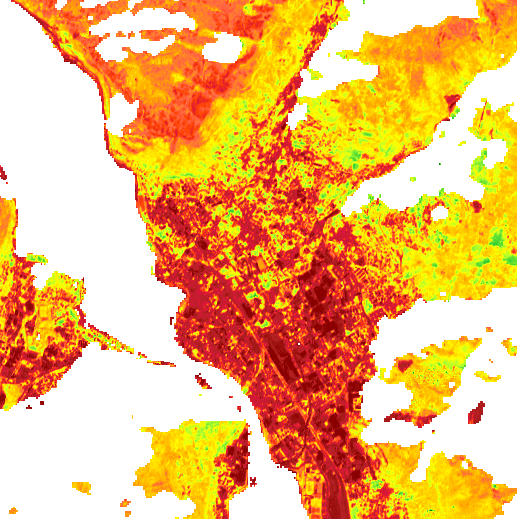
Urban Thermal Field Variance Index
Urban Thermal Field Variance Index
utfviDocumentation
Maps
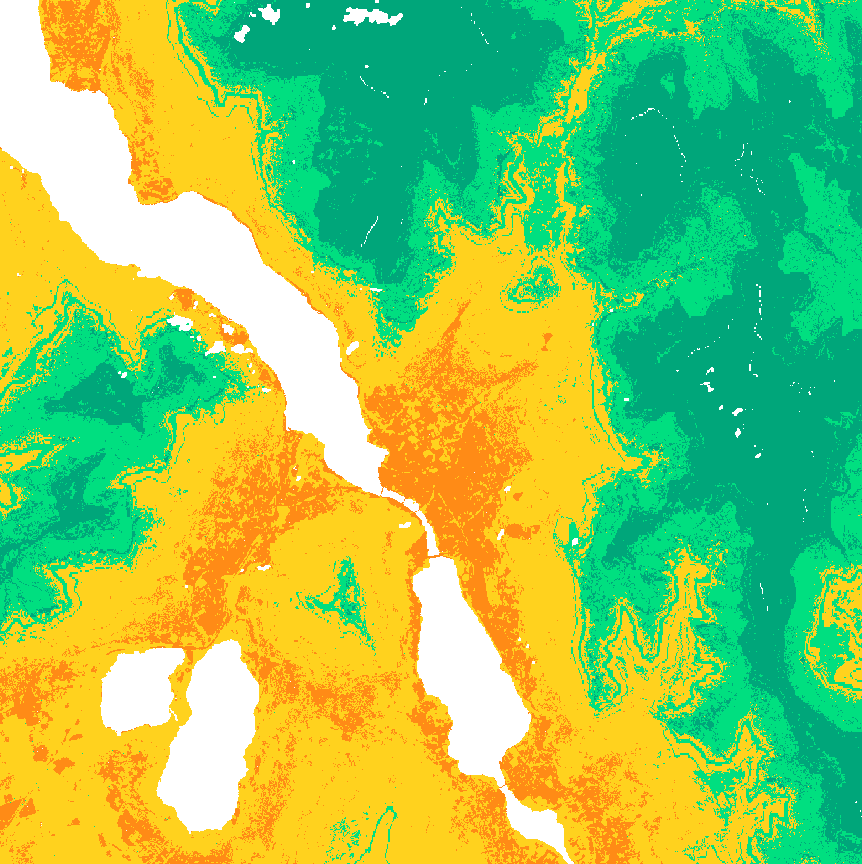
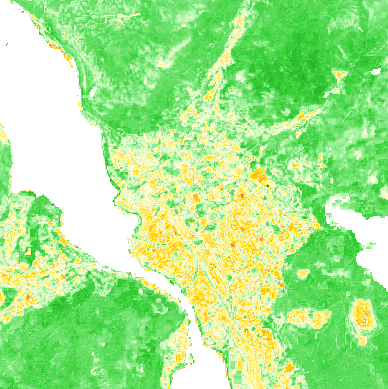
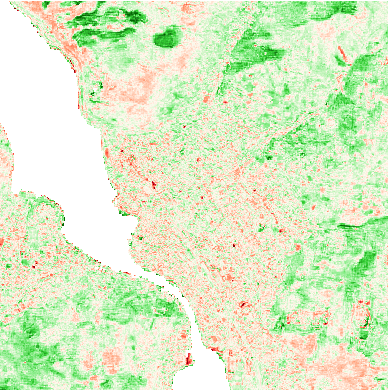
Normalized Difference Vegetation Index
Normalized Difference Vegetation Index
ndviDocumentation
Maps
NDVI annual range
NDVI annual range
ndvi_rangeDocumentation
Maps
NDVI range delta between years
NDVI range delta between years
ndvi_range_deltaDocumentation
Maps
Normalized Difference Water Index
Normalized Difference Water Index
ndwiDocumentation
Maps
NDWI annual range
NDWI annual range
ndwi_rangeDocumentation
Maps
NDWI range delta between years
NDWI range delta between years
ndwi_range_deltaDocumentation
Maps
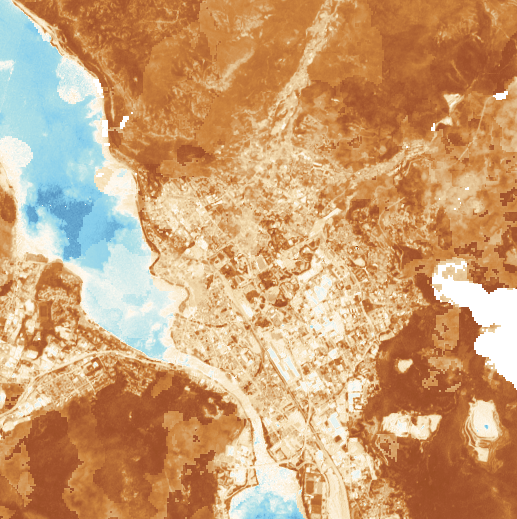
Normalized Difference Moisture Index
Normalized Difference Moisture Index
ndmiDocumentation
Maps
NDMI annual range
NDMI annual range
ndmi_rangeDocumentation
Maps
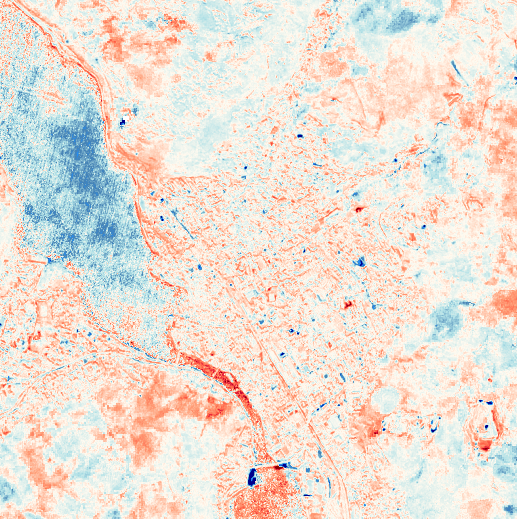
NDMI range delta between years
NDMI range delta between years
ndmi_range_deltaDocumentation

Maps
Artificial light intensity
Artificial light intensity
light_pollutionDocumentation
Maps
Light pollution annual range
Light pollution annual range
light_pollution_rangeDocumentation
Maps
Light pollution range delta
Light pollution range delta
light_pollution_range_deltaDocumentation

Maps
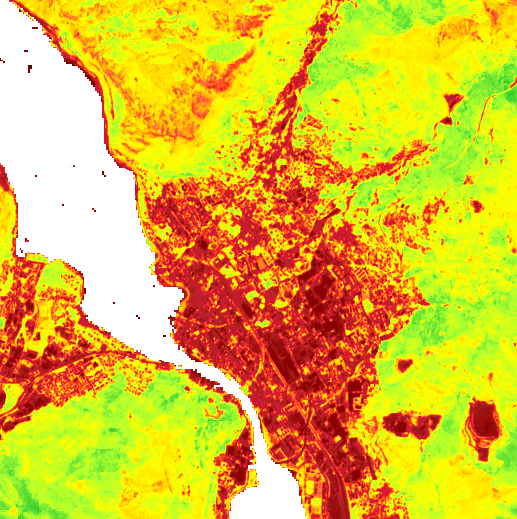
Built-up Surface Fraction
Built-up Surface Fraction
busfDocumentation

Maps
Population Density
Population Density
pdDocumentation

Maps
Aridity
Aridity index based on the ratio of precipitation to evapotranspiration
aridityDocumentation

Maps
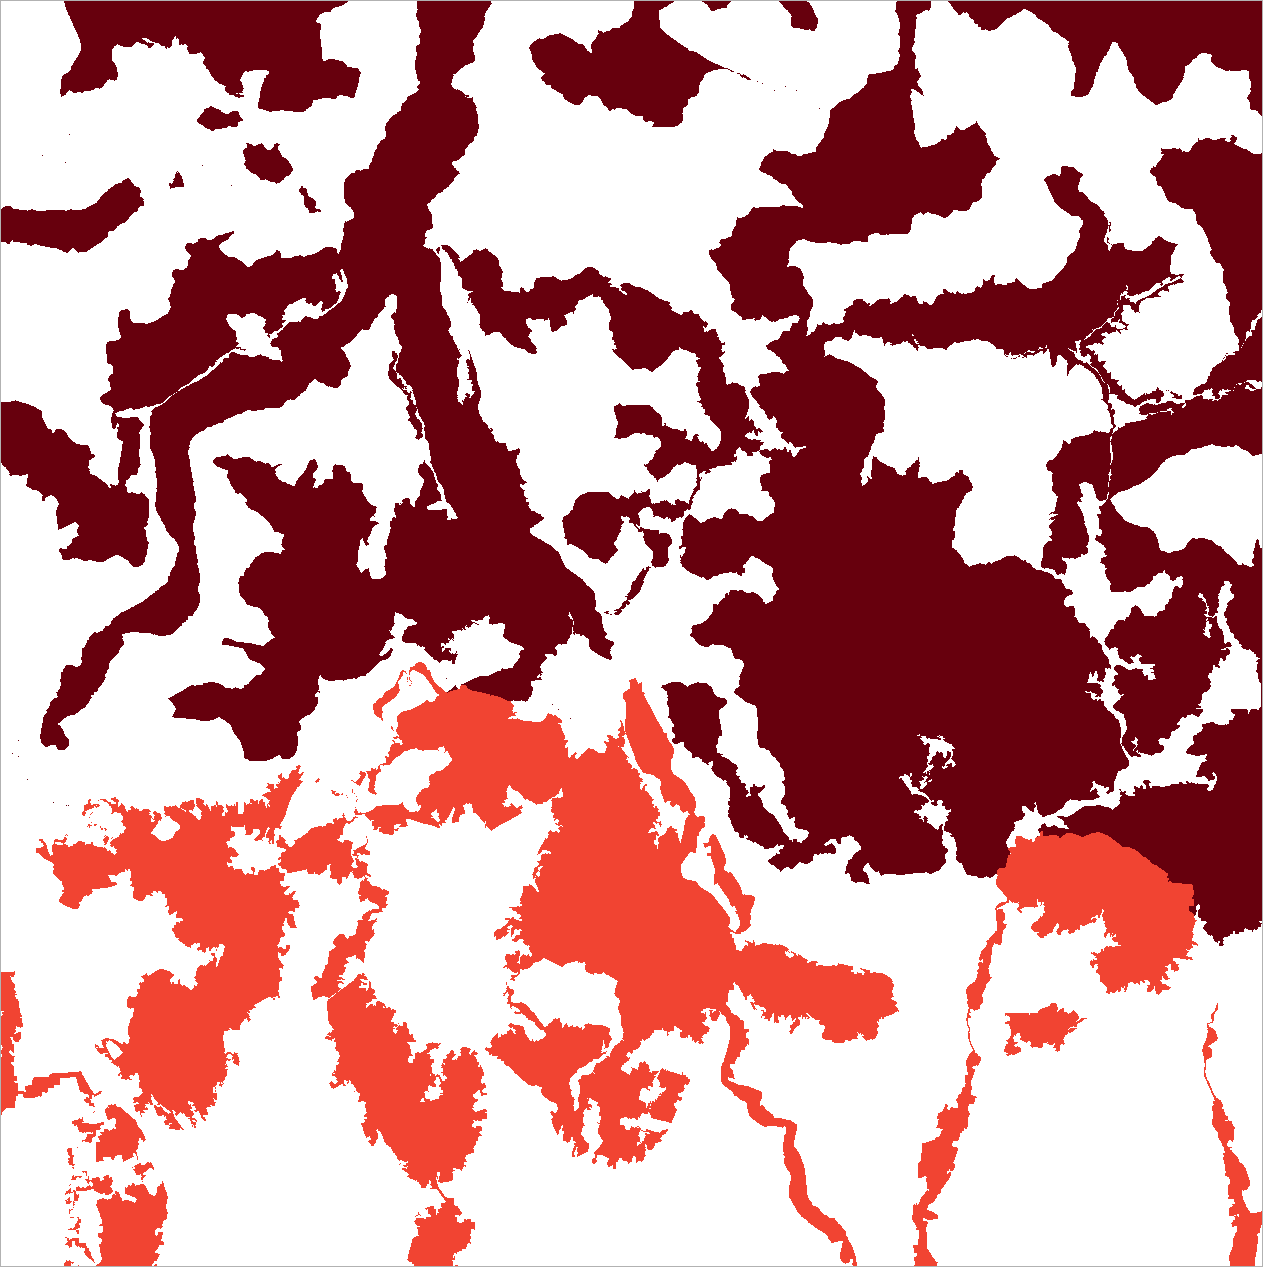
Hydrogeological flood risk
Hydrogeological flood risk
flood_riskDocumentation

Maps
Evapotranspiration
Evapotranspiration
etDocumentation

Maps
Degree of Urbanization
Degree of Urbanization
duDocumentation
Maps
Protected natural areas
Protected natural areas
protected_areasDocumentation
Maps
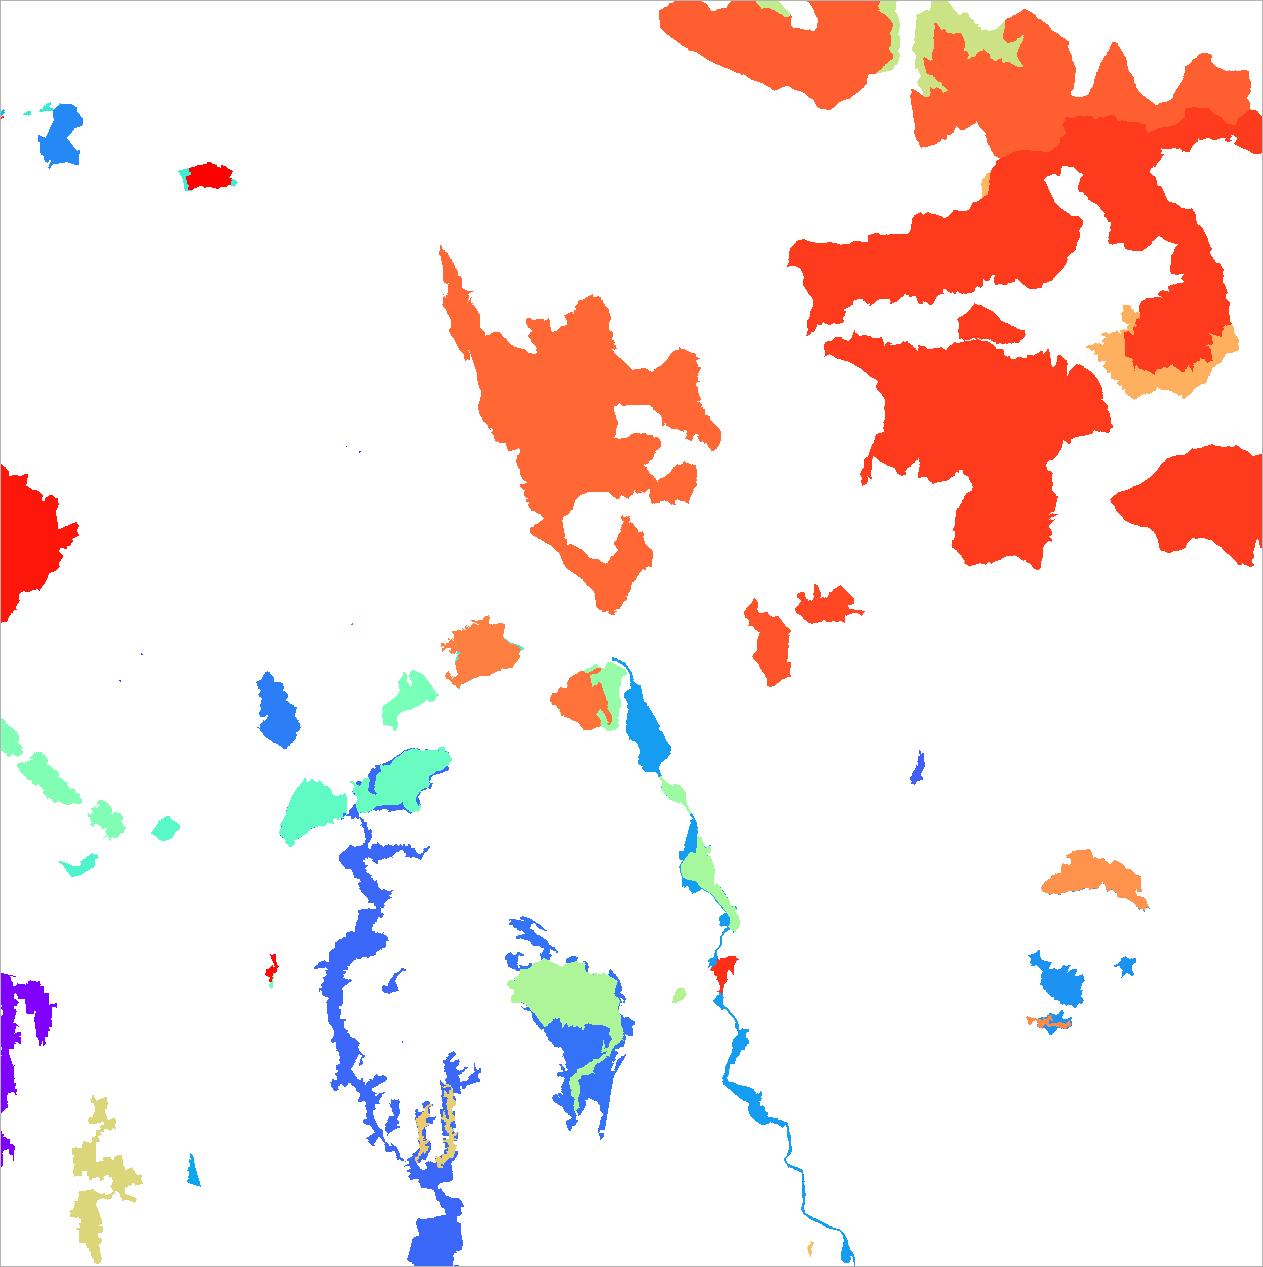
European ecosystems classification
European ecosystems classification
eu_ecosystemsDocumentation

Maps
Wildlife corridors
Wildlife corridors
ecological_corridorsDocumentation

Maps
Stepping stone habitats
Stepping stone habitats
stepping_zonesDocumentation
Maps
Ecological transition areas
Ecological transition areas
transition_areasDocumentation

Maps
Carbon stock overview
Carbon stock overview
carbon_stockDocumentation
Maps
Current above-ground biomass carbon
Current above-ground biomass carbon
carbon_stock_current_agbDocumentation

Maps
Current below-ground biomass carbon
Current below-ground biomass carbon
carbon_stock_current_bgbDocumentation

Maps
Current total biomass carbon
Current total biomass carbon
carbon_stock_current_agb_bgbDocumentation

Maps
Current soil organic carbon
Current soil organic carbon
carbon_stock_current_socDocumentation

Maps
Current total carbon stock
Current total carbon stock
carbon_stock_current_totalDocumentation

Maps
Unrealized AGB carbon potential
Unrealized AGB carbon potential
carbon_stock_unrealized_potential_agbDocumentation

Maps
Unrealized BGB carbon potential
Unrealized BGB carbon potential
carbon_stock_unrealized_potential_bgbDocumentation

Maps
Unrealized biomass carbon potential
Unrealized biomass carbon potential
carbon_stock_unrealized_potential_agb_bgbDocumentation

Maps
Unrealized SOC potential
Unrealized SOC potential
carbon_stock_unrealized_potential_socDocumentation

Maps
Unrealized total carbon potential
Unrealized total carbon potential
carbon_stock_unrealized_potential_totalDocumentation

Maps
Future unrealized carbon potential
Future unrealized carbon potential
carbon_stock_future_unrealized_potentialDocumentation

Maps
Future carbon potential change
Future carbon potential change
carbon_stock_future_unrealized_potential_changeDocumentation
Maps
Active fire detection
Active fire detection
active_fireDocumentation
Maps
Socioeconomic indicators
Socioeconomic indicators
socioeconomicDocumentation

Maps
Harmonized World Soil Database
Harmonized World Soil Database
hwsdDocumentation
Maps
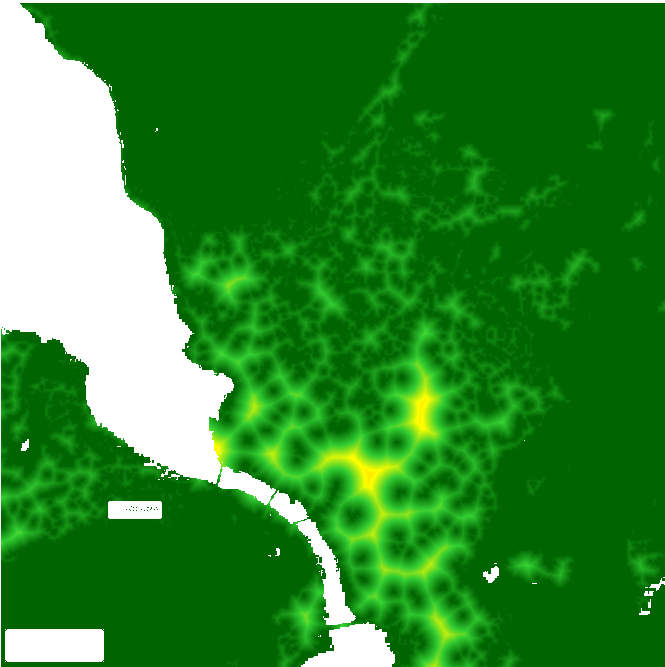
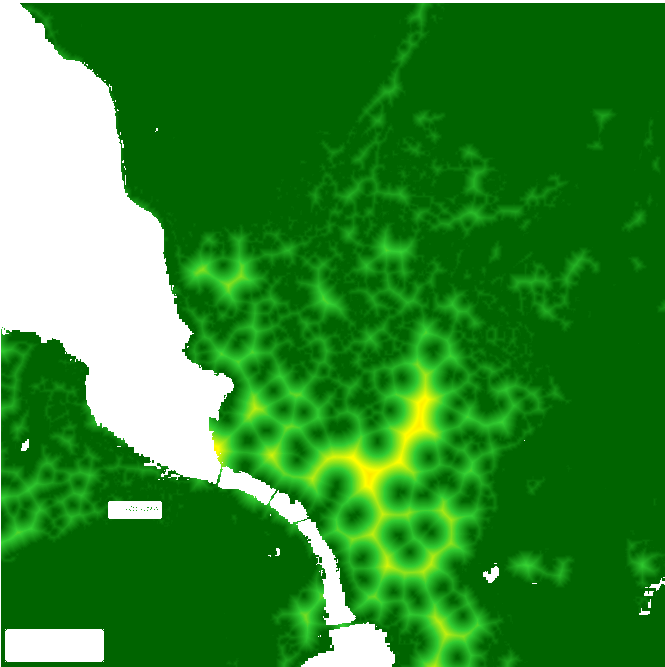
Distance to green areas
Distance to green areas
distance_to_greenDocumentation
Maps
Distance to small gardens
Distance to small gardens
distance_to_small_gardensDocumentation
Maps
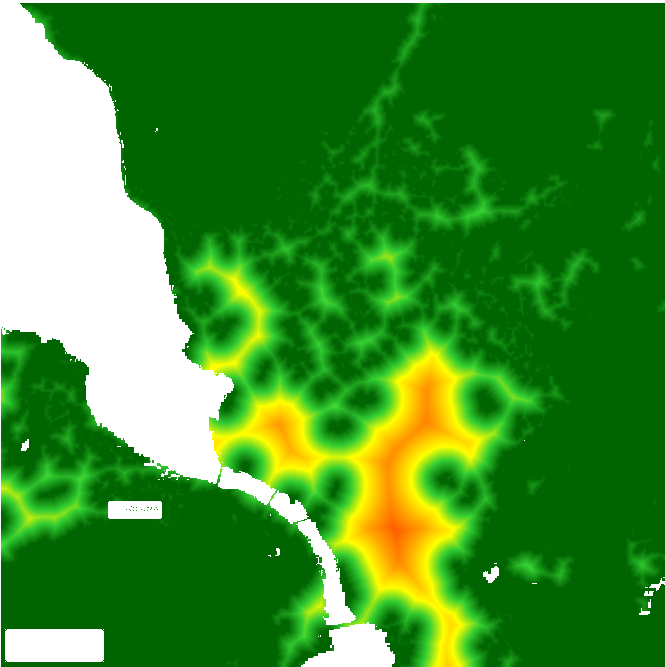
Distance to parks
Distance to parks
distance_to_parksDocumentation
Maps
Carbon Monoxide
Carbon monoxide (CO) concentration analysis over time
carbon_monoxideDocumentation
Maps
Formaldehyde concentration
Formaldehyde concentration
formaldehydeDocumentation

Maps
Methane
Methane (CH4) concentration analysis over time
methaneDocumentation
Maps
Nitrogen Dioxide
Nitrogen dioxide (NO2) concentration analysis over time
nitrogen_dioxideDocumentation
Maps
Ozone
Ozone (O3) concentration analysis over time
ozoneDocumentation

Maps
Sulfur dioxide concentration
Sulfur dioxide concentration
sulfur_dioxideDocumentation

Maps
UV aerosol index
UV aerosol index
uv_aerosol_indexDocumentation

Maps
Fertilizer pollution overview
Fertilizer pollution overview
fertilizer_pollutionDocumentation
Maps
Nitrogen fertilizer pollution
Nitrogen fertilizer pollution
fertilizer_pollution_nDocumentation

Maps
Phosphorus fertilizer pollution
Phosphorus fertilizer pollution
fertilizer_pollution_pDocumentation

Maps
Potassium fertilizer pollution
Potassium fertilizer pollution
fertilizer_pollution_kDocumentation

Maps
Toxic metals soil pollution
Toxic metals soil pollution
toxic_metals_soil_pollutionDocumentation
Maps
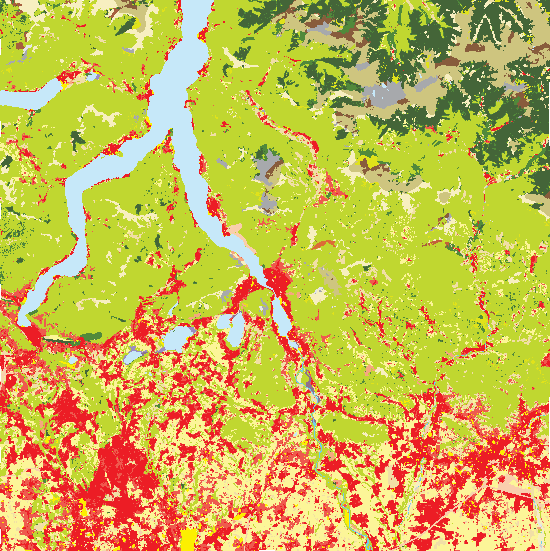
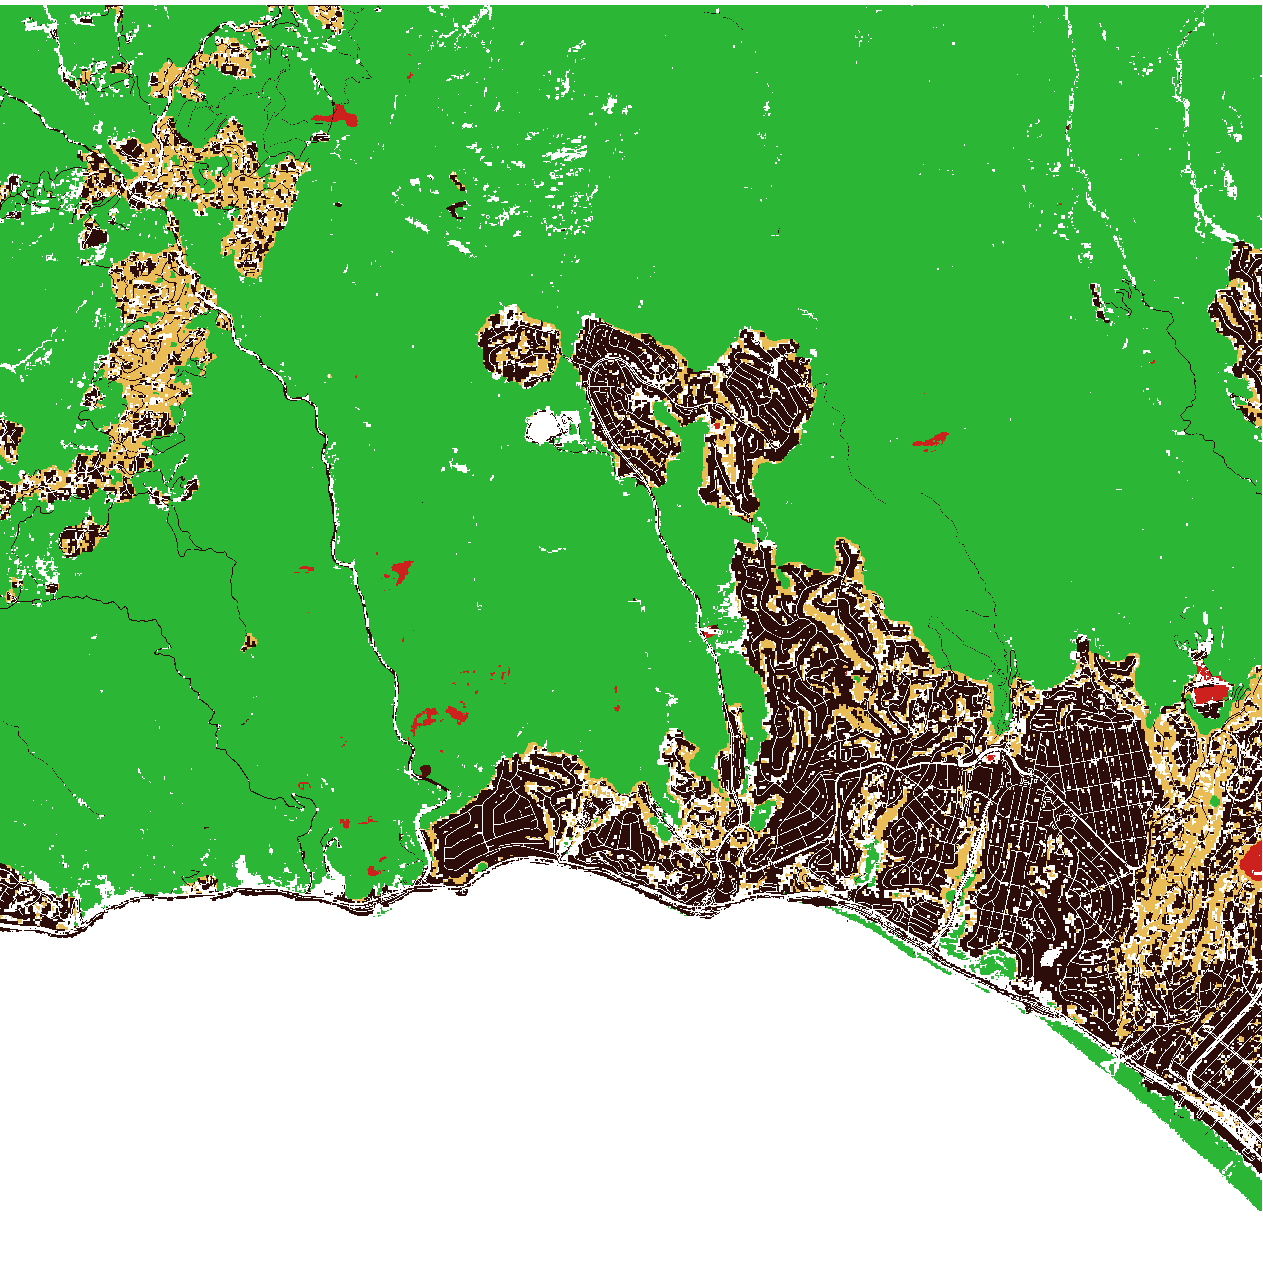
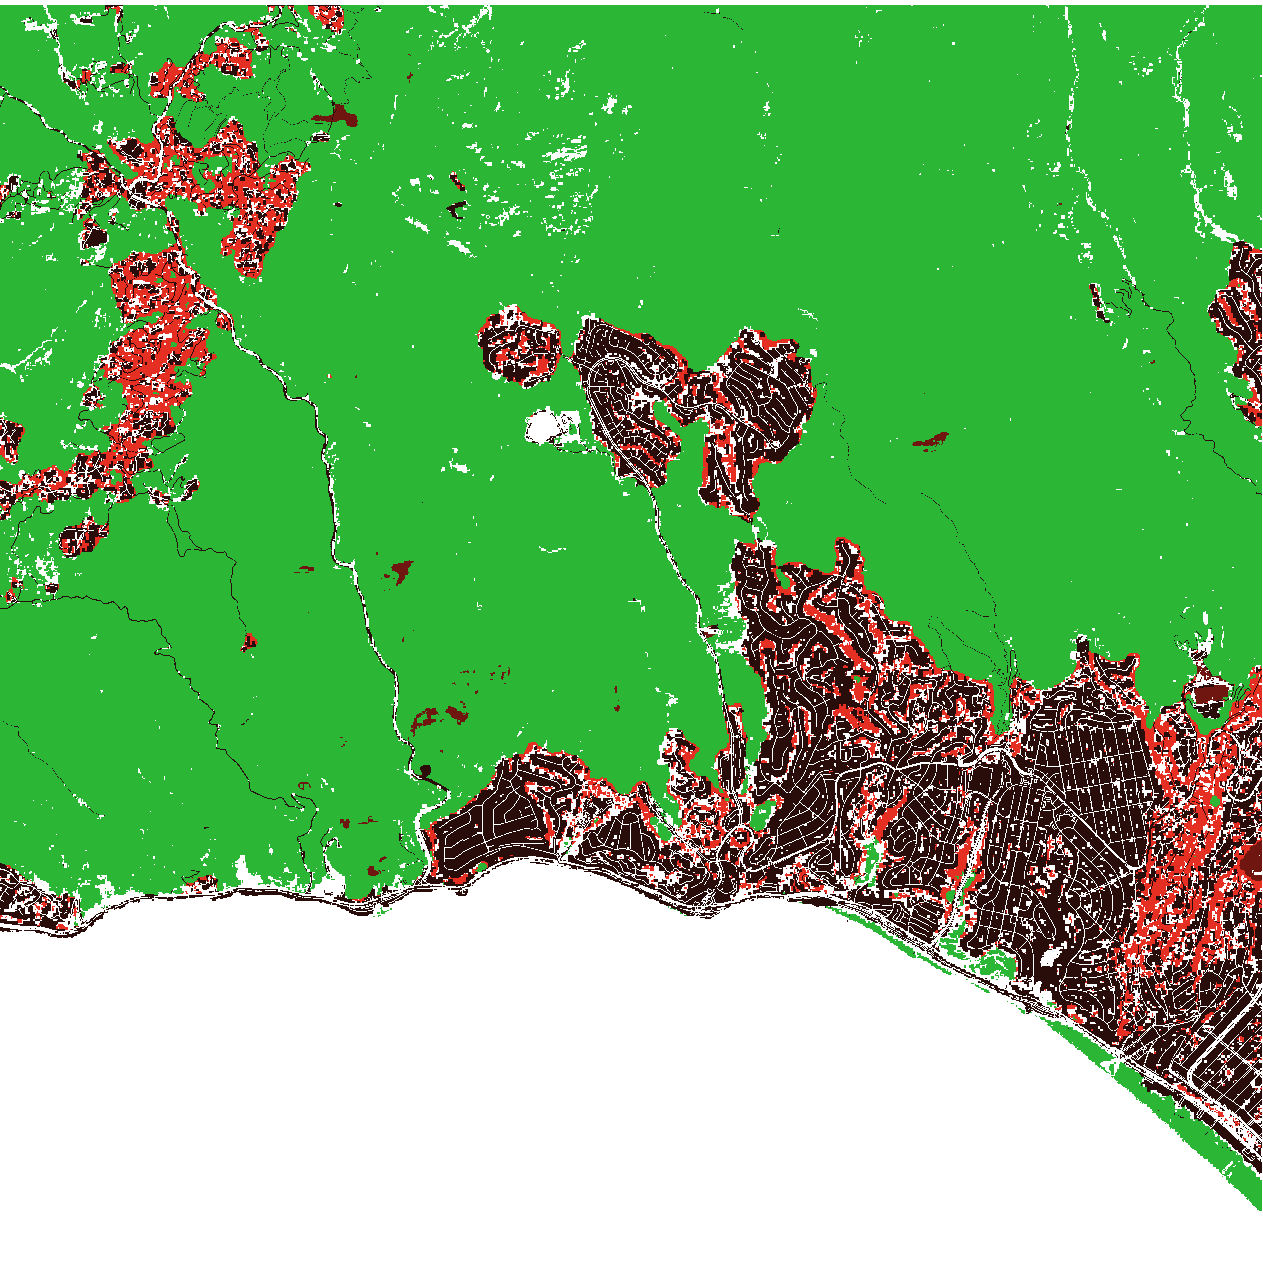
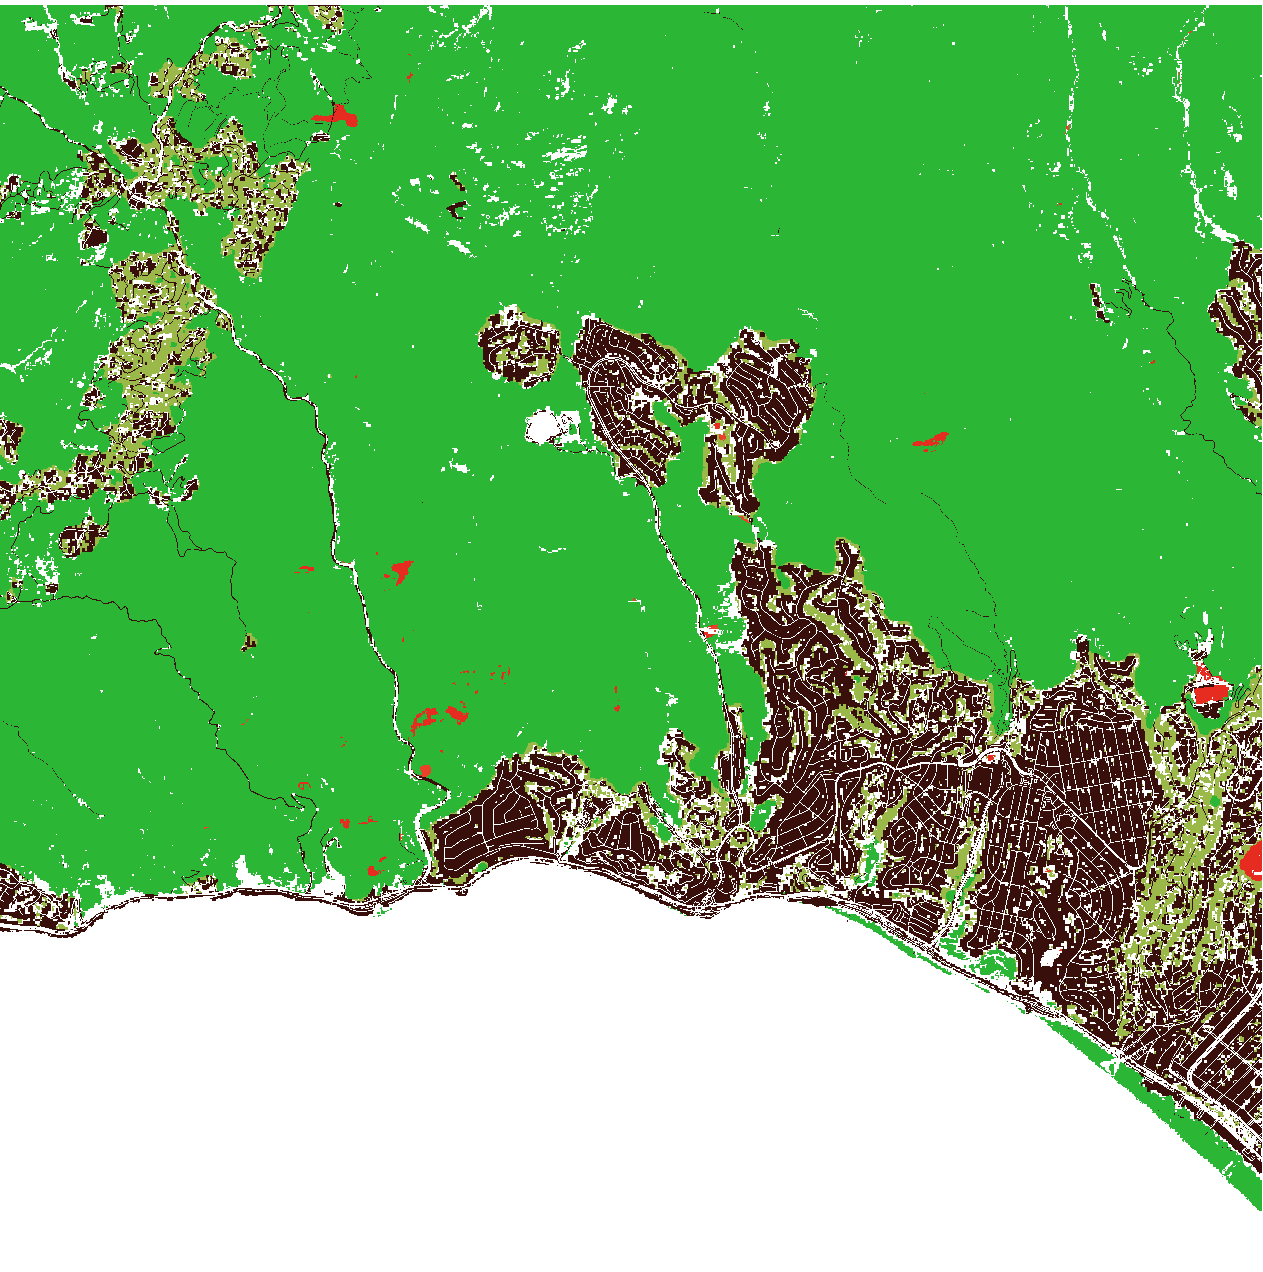
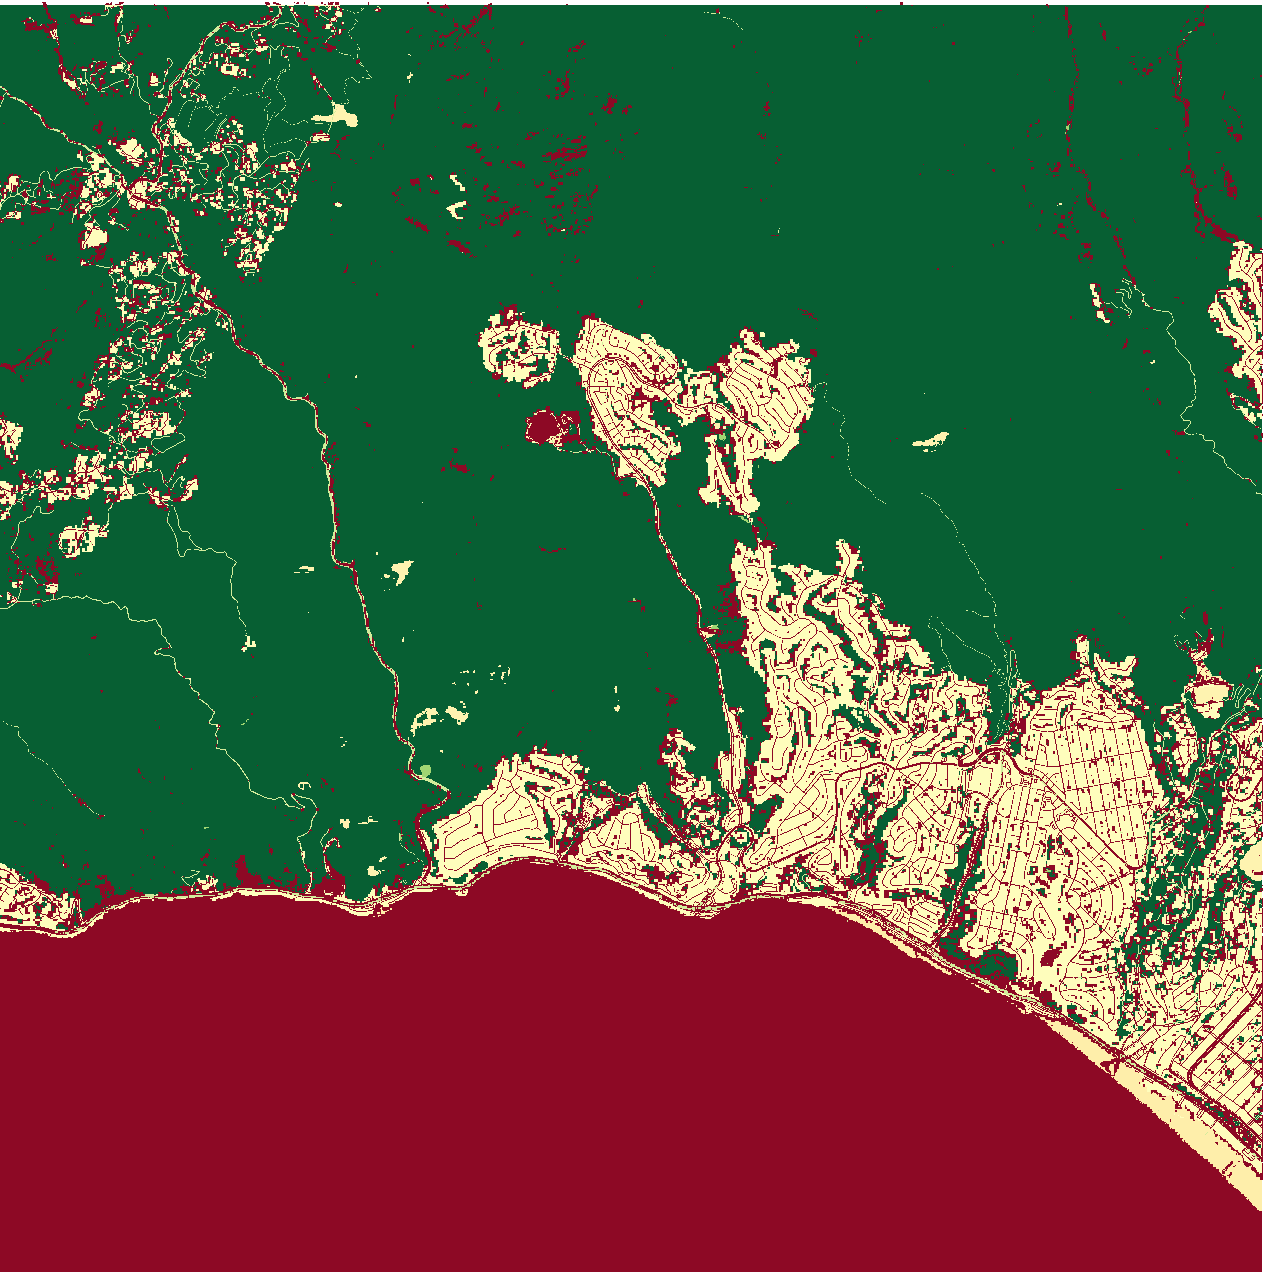
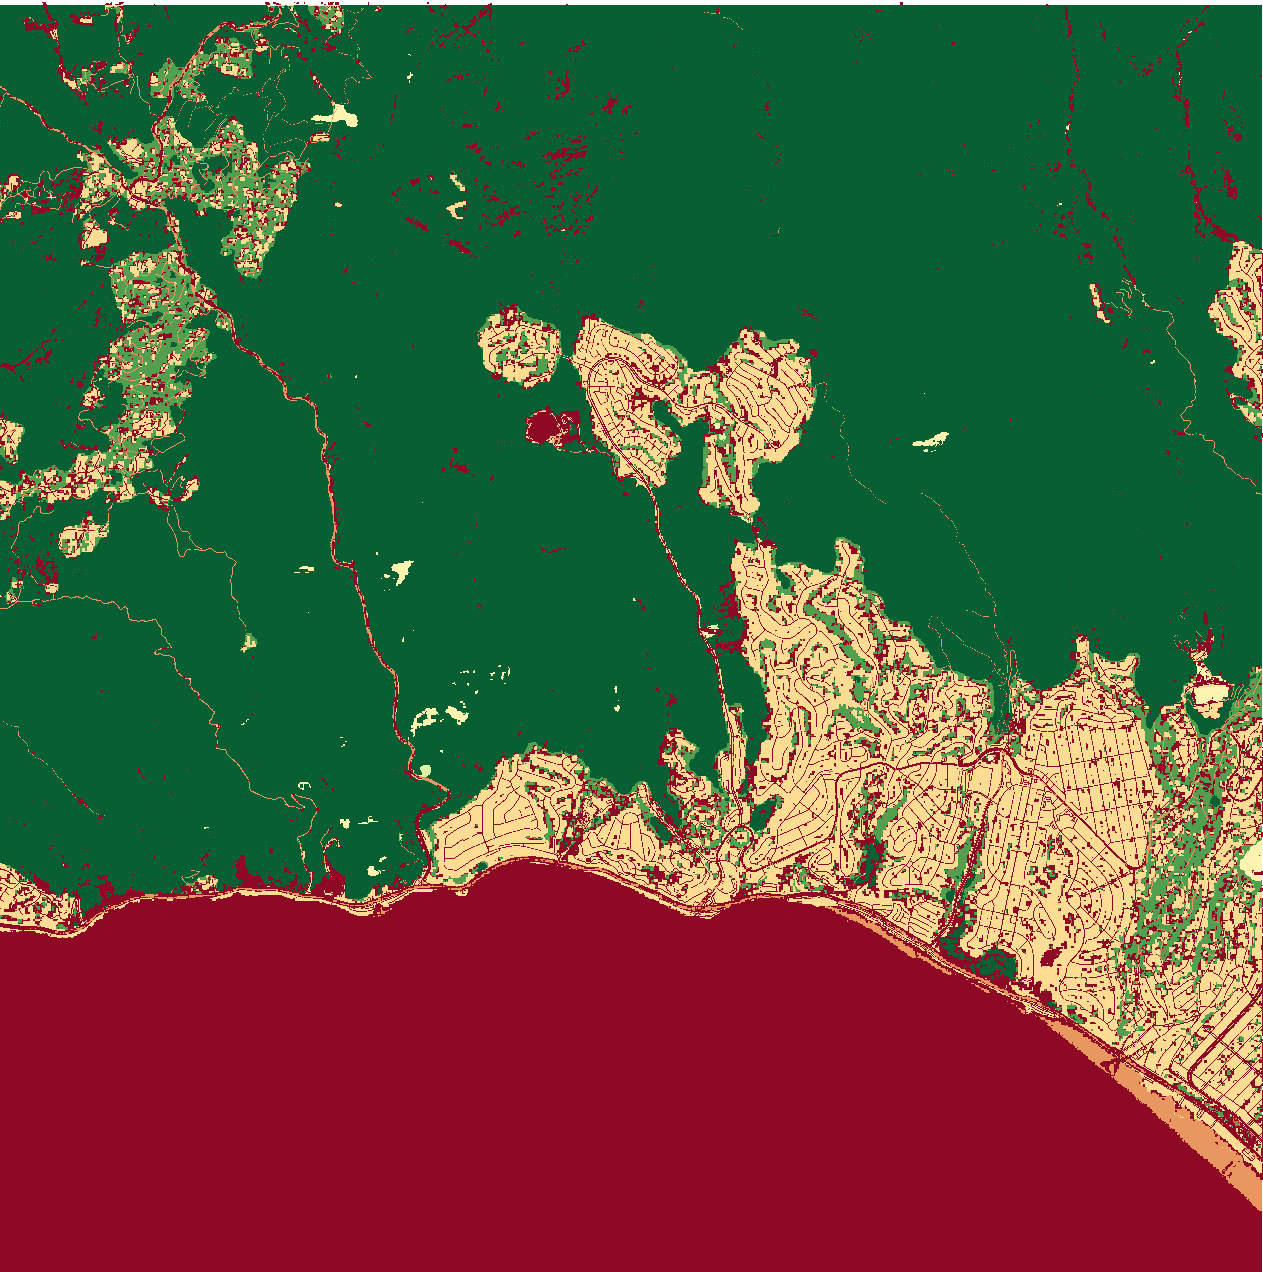
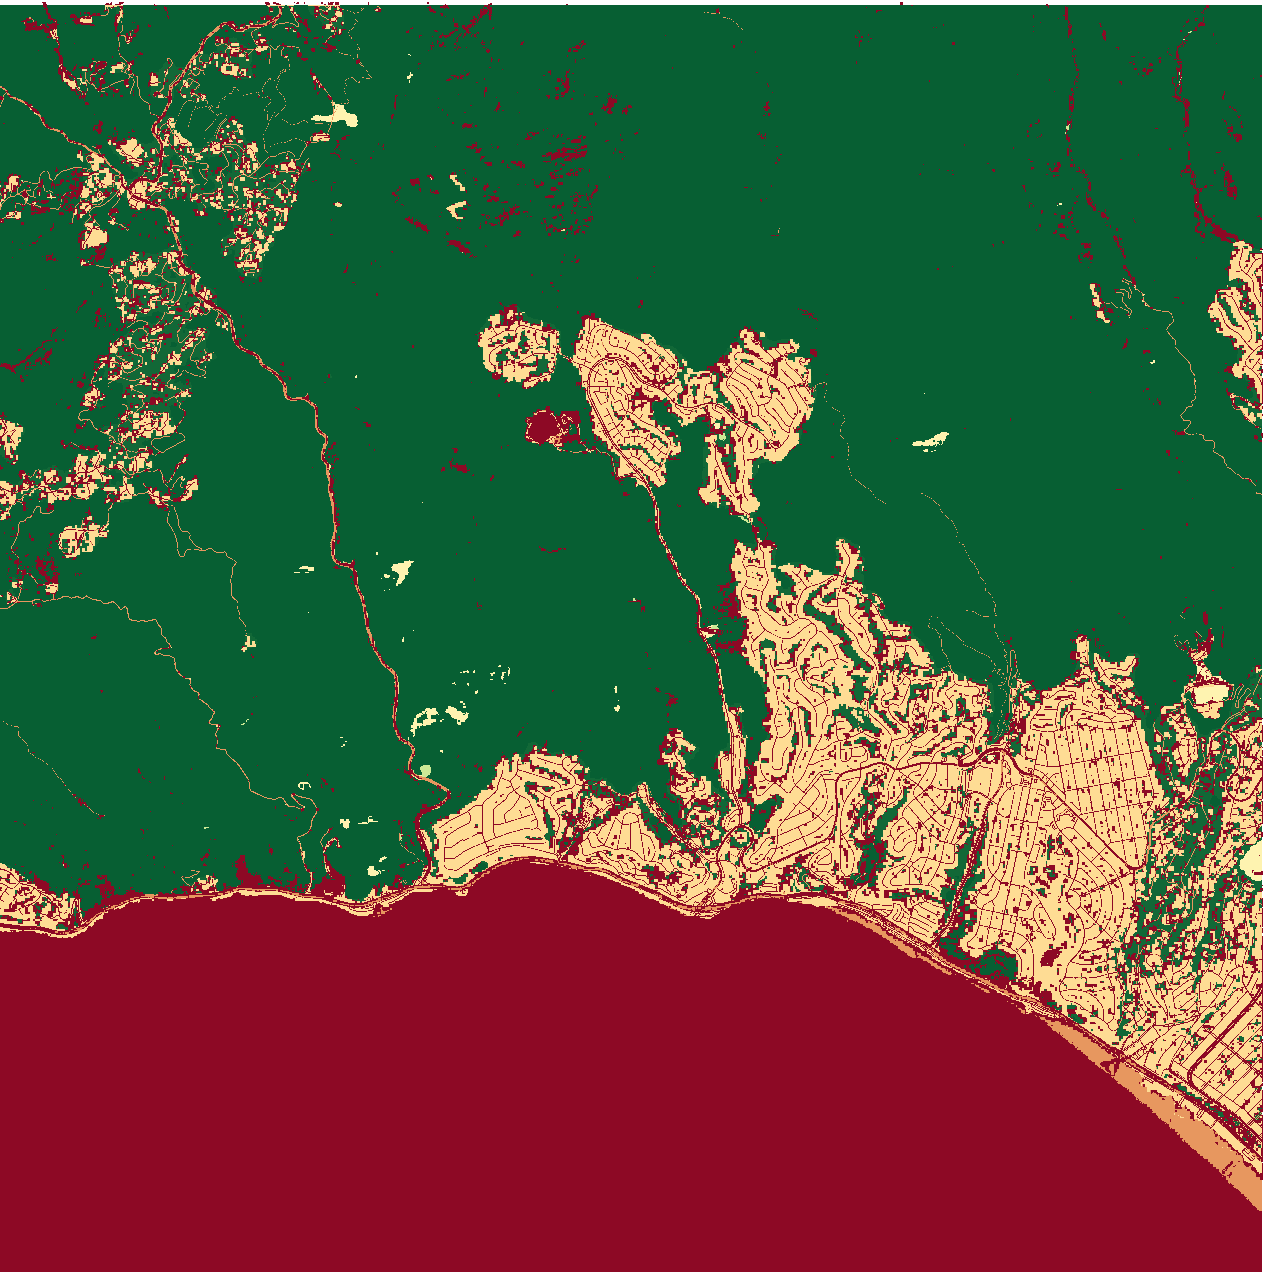
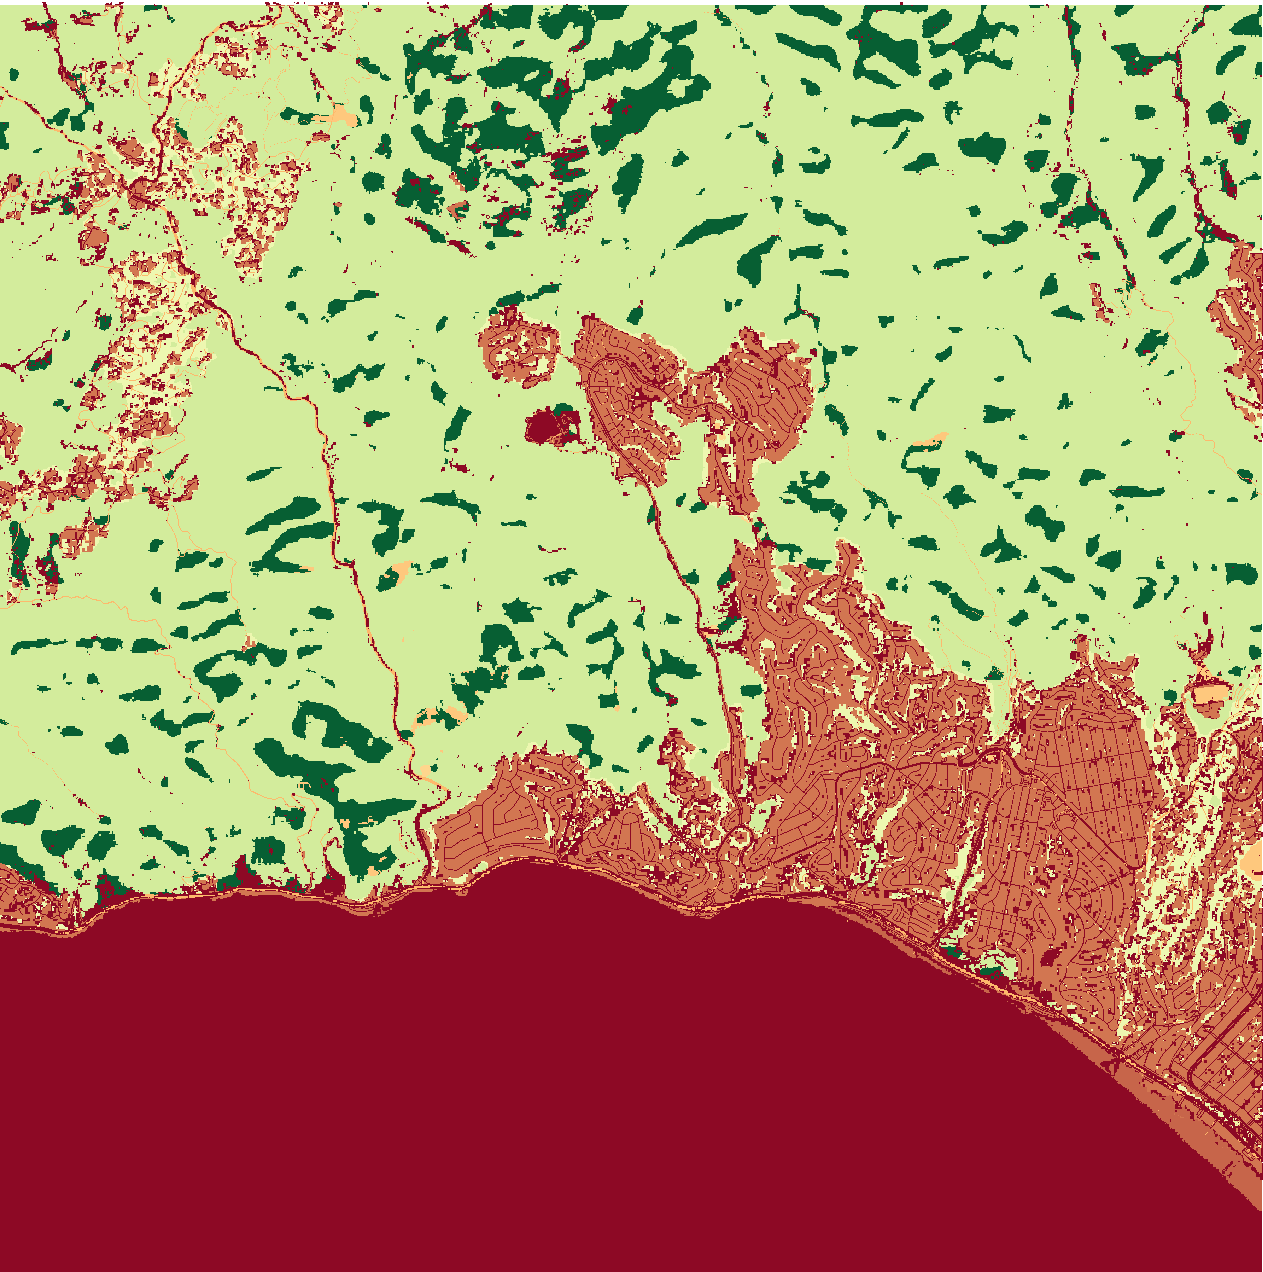
Land Cover Classification
CLC computation prerequisite for biodiversity maps (MSA, PA, NS, NP, FA)
clcDocumentation
Maps
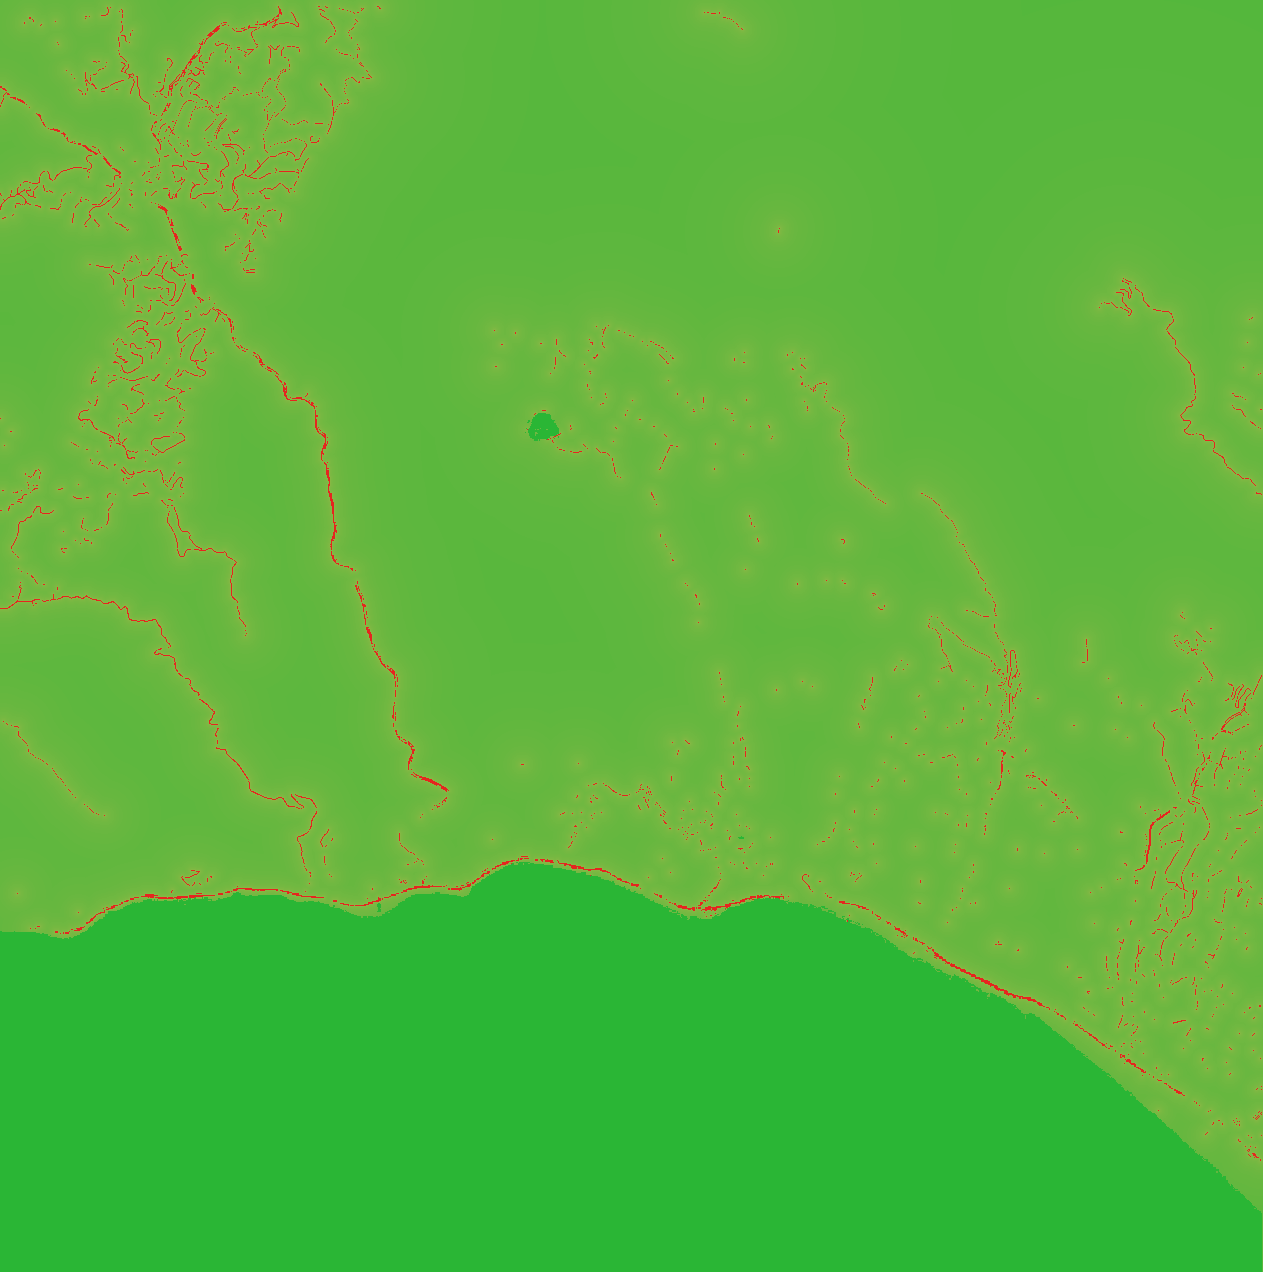
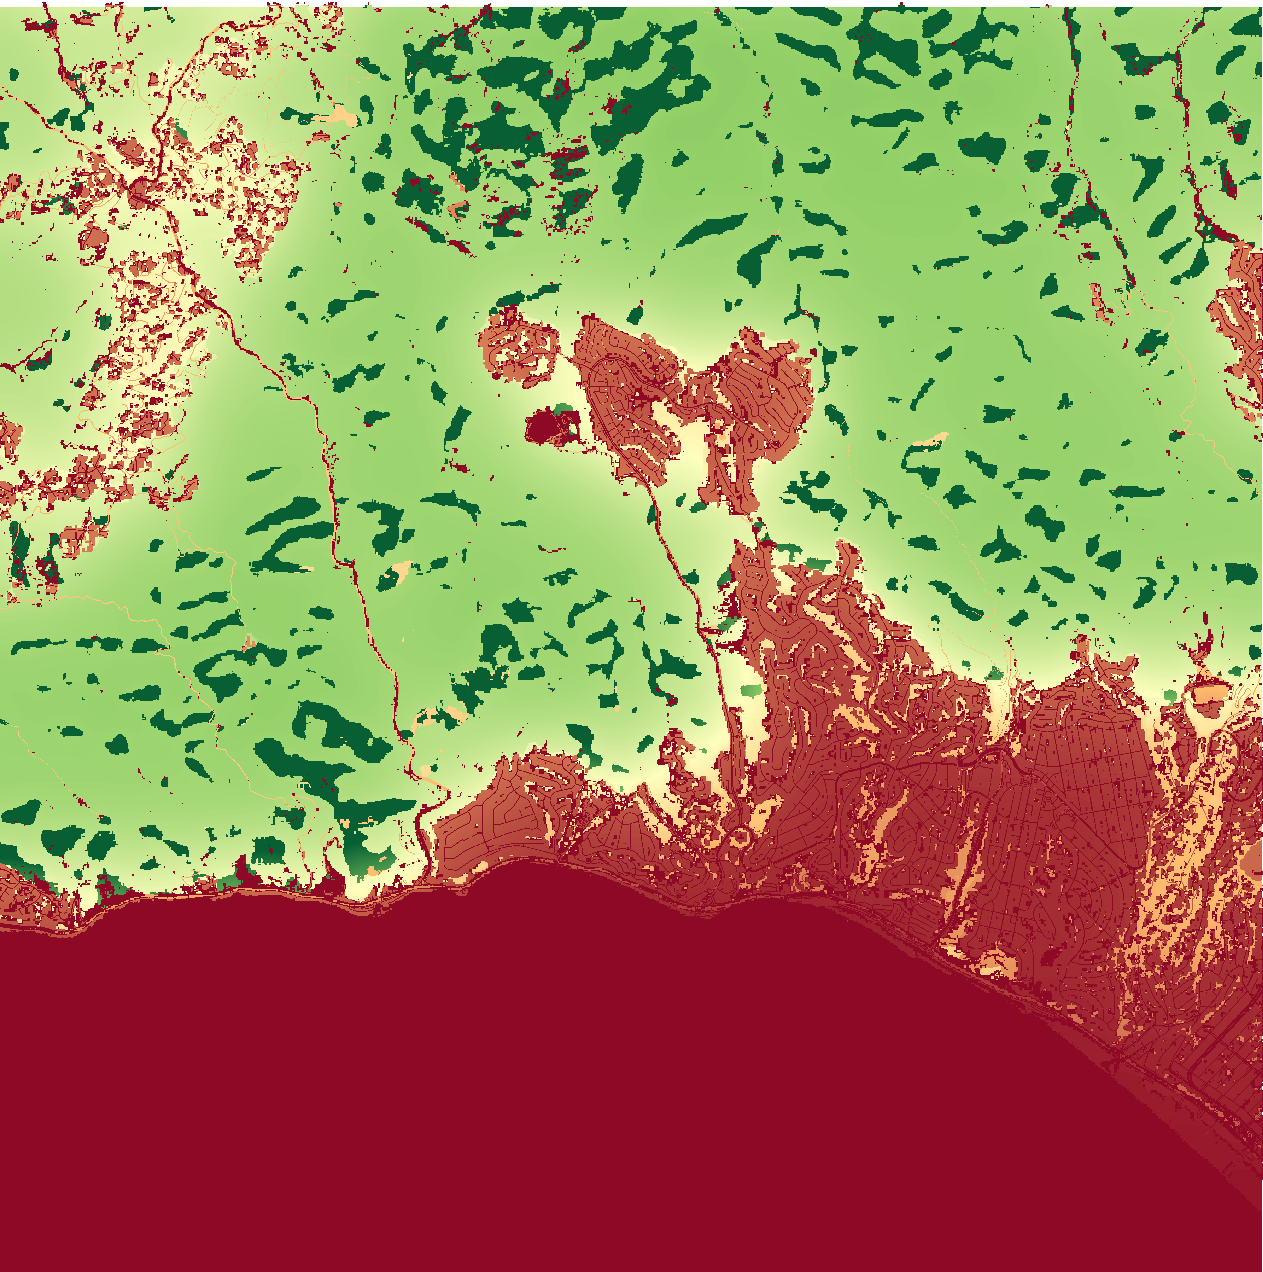
Soil impermeability
Soil impermeability
impermeabilityDocumentation
Maps
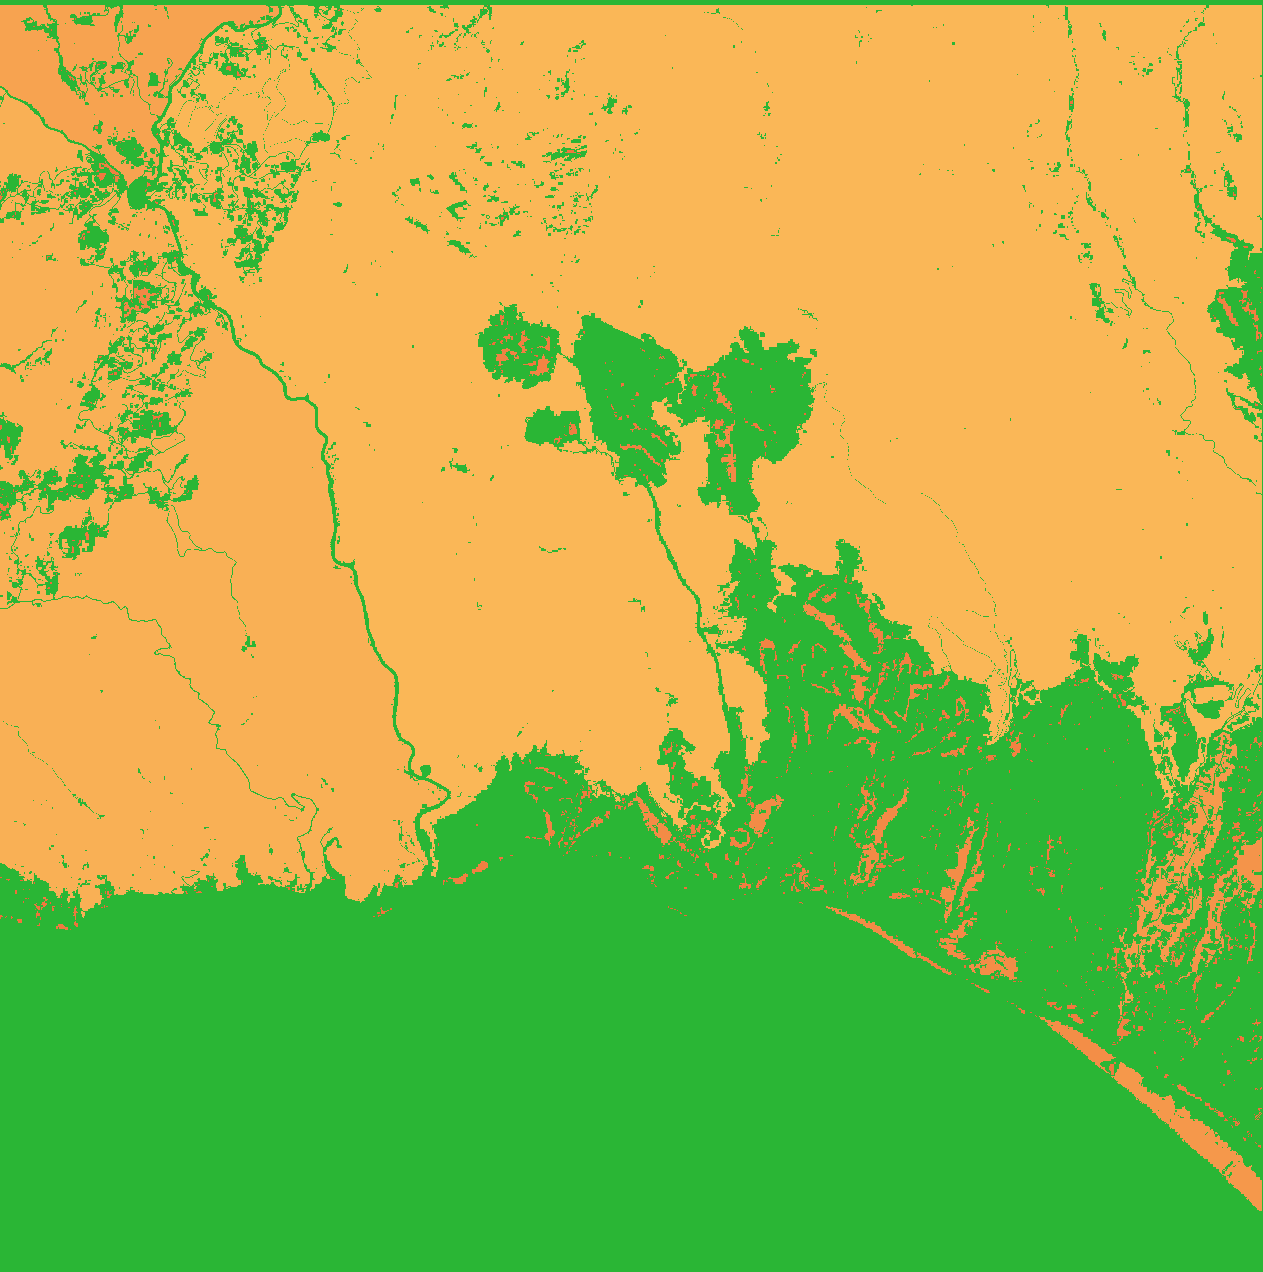
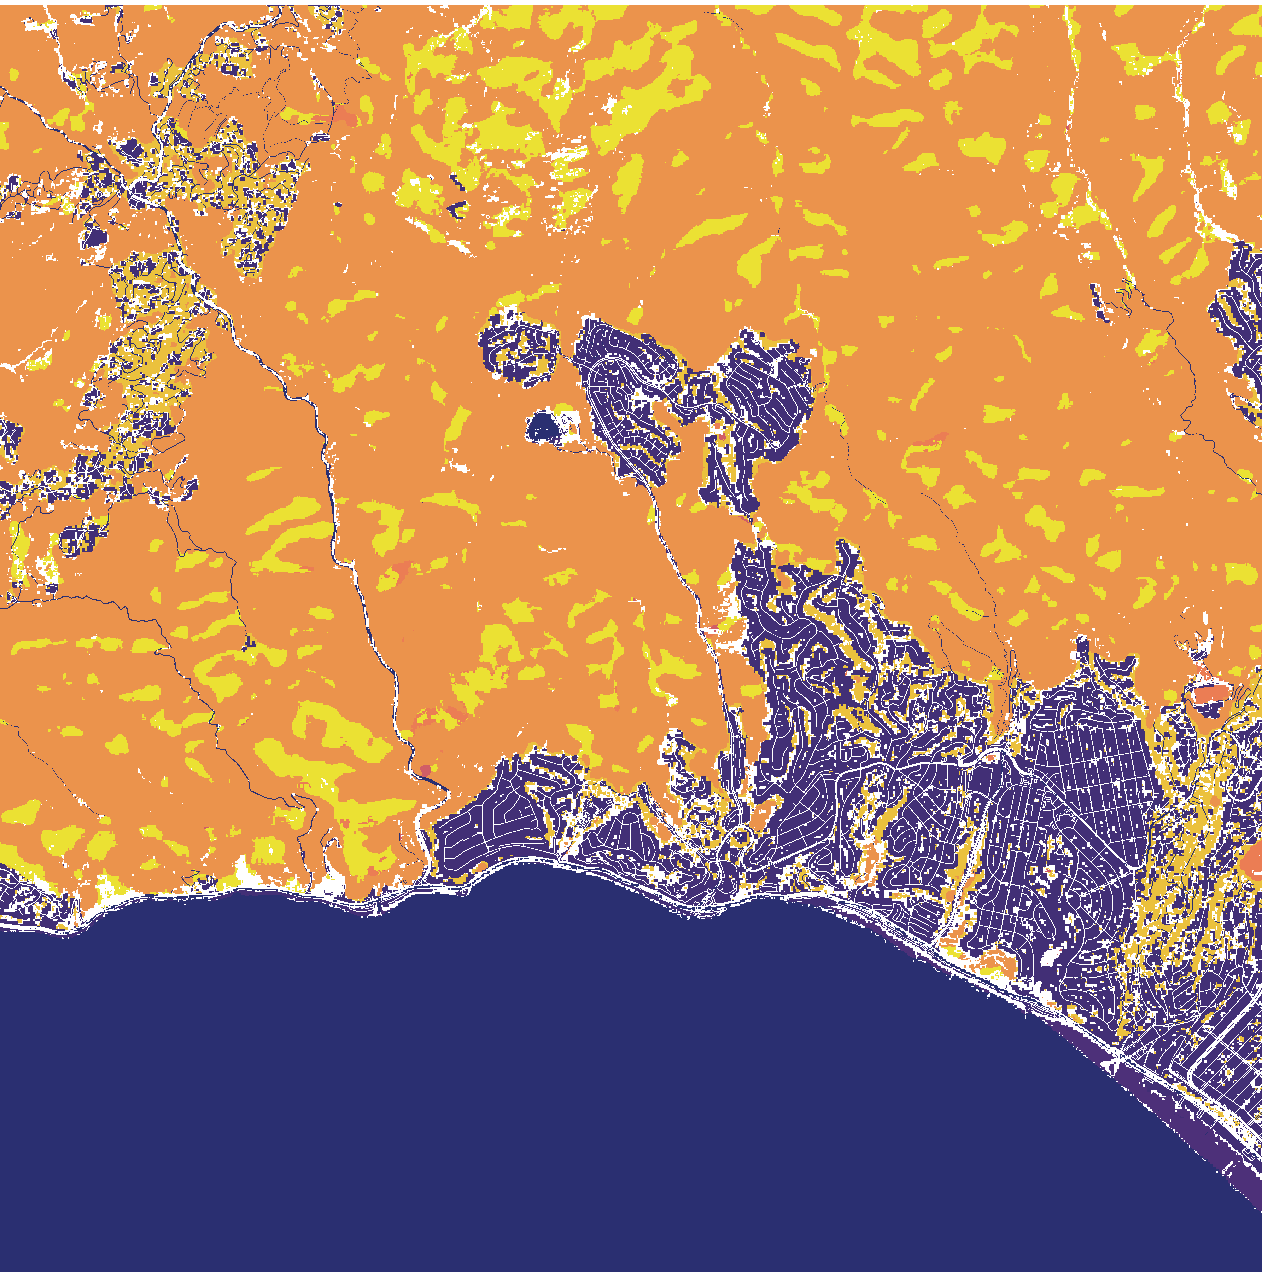
Natural and Agricultural Areas
Natural and Agricultural Areas
naaDocumentation
Maps
Spectrum device heatmap
Spectrum device heatmap
spectrum_heatmapDocumentation
Maps
PollyX device heatmap
PollyX device heatmap
pollyx_heatmapDocumentation
Maps
Extreme weather events
Extreme weather events
extreme_eventsDocumentation
Data
Cultural and artistic heritage POIs
Cultural and artistic heritage POIs
artistic_heritageDocumentation
Data
3Bee Oasi ecological features
3Bee Oasi ecological features
threebee_oasiDocumentation
KPI
Aqueduct Water Risk
Water risk assessment using WRI Aqueduct data
water_riskDocumentation
KPI
IUCN Red List
Evaluates species presence against IUCN Red List of Threatened Species
red_listDocumentation
Reports
Biodiversity Report
Full biodiversity report with data aggregation, charts, and AI analysis via Google Docs
report_generationDocumentation
AI
AI Comment Generation
AI-powered analysis and commentary on monitoring data using Gemini
ai_commentsDocumentation
Maps
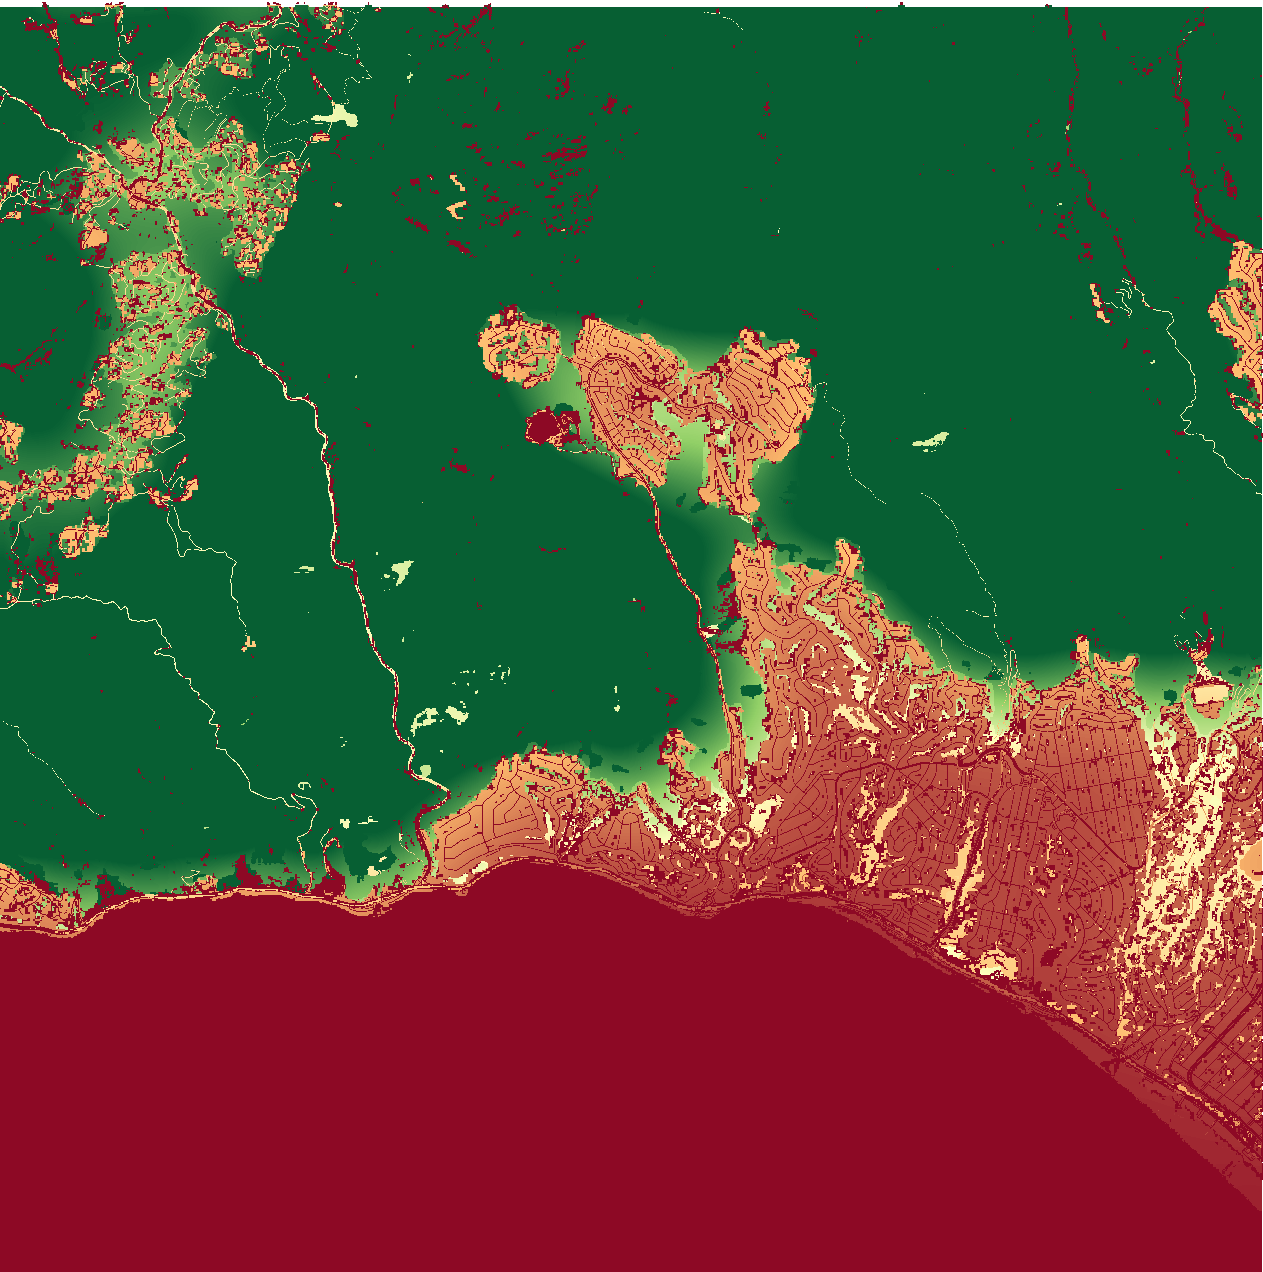
Mean Species Abundance
Mean Species Abundance
msaDocumentation

Maps
MSA Climate Change component
MSA Climate Change component
msa_ccDocumentation
Maps
MSA Infrastructure component
MSA Infrastructure component
msa_iDocumentation
Maps
MSA Fragmentation component
MSA Fragmentation component
msa_fDocumentation
Maps
MSA Land Use - Plants
MSA Land Use - Plants
msa_lu_plantsDocumentation
Maps
MSA Land Use - Animals
MSA Land Use - Animals
msa_lu_animalsDocumentation
Maps
Pollination Abundance
Pollination Abundance
paDocumentation
Maps
PA - Soil excavators nesting
PA - Soil excavators nesting
pa_ns_soilexcavatorsDocumentation

Maps
PA - Sand excavators nesting
PA - Sand excavators nesting
pa_ns_sandexcavatorsDocumentation
Maps
PA - Underground cavities nesting
PA - Underground cavities nesting
pa_ns_underground_cavitiesDocumentation

Maps
PA - Wetland cavities nesting
PA - Wetland cavities nesting
pa_ns_aboveground_cavities_wetlandDocumentation
Maps
PA - Vegetated cavities nesting
PA - Vegetated cavities nesting
pa_ns_aboveground_cavities_vegetatedDocumentation

Maps
PA - Artificial nesting
PA - Artificial nesting
pa_ns_artificialDocumentation

Maps
PA - Coastal area nesting
PA - Coastal area nesting
pa_ns_coastal_areaDocumentation
Maps
Nesting Sites suitability
Nesting Sites suitability
nsDocumentation
Maps
NS - Soil excavators
NS - Soil excavators
ns_ns_soilexcavatorsDocumentation

Maps
NS - Sand excavators
NS - Sand excavators
ns_ns_sandexcavatorsDocumentation
Maps
NS - Underground cavities
NS - Underground cavities
ns_ns_underground_cavitiesDocumentation

Maps
NS - Wetland cavities
NS - Wetland cavities
ns_ns_aboveground_cavities_wetlandDocumentation
Maps
NS - Vegetated cavities
NS - Vegetated cavities
ns_ns_aboveground_cavities_vegetatedDocumentation

Maps
NS - Artificial nesting
NS - Artificial nesting
ns_ns_artificialDocumentation

Maps
NS - Coastal areas
NS - Coastal areas
ns_ns_coastal_areaDocumentation
Maps
Nectariferous Potential
Nectariferous Potential
npDocumentation
Maps
Flowering Area
Flowering Area
faDocumentation
Risks
Climate Change
Change in average temperature compared to the 1950-1970 baseline and increase in extreme event frequency.
climate_change
Risks
Wind
Wind speed and direction analysis over time
wind
Risks
Heat Wave
Extended periods of extreme temperatures causing infrastructure strain and productivity loss.
heat_wave
Risks
Cold Wave
Extended periods of extremely low temperatures impacting infrastructure and operations.
cold_wave
Risks
Total Precipitation
Total precipitation (rain + snow) analysis over time
precipitation
Risks
Precipitation Pattern Change
Long-term change in precipitation patterns impacting land productivity.
precipitation_pattern_change
Risks
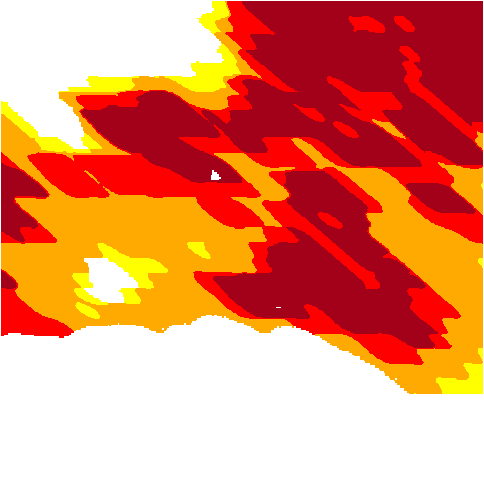
Wildfire
Risk of wildfires threatening structures, grounds, and air quality.
fire
Risks
Heat Stress
Health and productivity risk from prolonged excessive heat conditions.
heat_stress
Risks
Extreme Heat
Record-breaking temperatures causing infrastructure failures and health risks.
extreme_heat
Risks
Extreme Storm
Violent storms with hurricane-force winds and risk of structural failure.
extreme_storm
Risks
Drought
Prolonged water scarcity with operational restrictions and increased costs.
drought
Risks
Desertification
Progressive land degradation with loss of productivity and land value.
desertification
Risks
Flood
Risk of flooding with structural damage and operational disruption.
flood
Risks
Aridity
Long-term drying trend impacting land productivity and increasing water costs.
risk_aridity
Risks
Water Stress
Imbalance between water demand and supply leading to restrictions and rationing.
water_stress
Risks
Air Quality
Health risk from air pollution and associated mortality rates.
air_quality
Risks
Landslide
Risk of slope instability with potential damage to foundations and structures.
landslide
Risks
Biodiversity Loss
Decline of local ecosystem health impacting ecosystem services like pollination.
biodiversity_loss
Risks
Earthquake
Seismic risk with potential structural damage ranging from minor to catastrophic.
earthquake
Risks
Volcanic Eruption
Risk from ash, lahars, and pyroclastic flows with potential destruction.
volcanic_eruption
Risks
Rising Ocean Temperature
Sea surface temperature anomalies impacting coastal ecosystems and ocean-dependent operations.
rising_ocean_temperature
Risks
Sea Level Rise
Recurring high-tide flooding, salinization, and progressive coastal land loss.
sea_level_rise
Risks
Coastal Flooding
Risk of storm surge flooding with structural damage and corrosion.
coastal_flooding
Risks
Coastal Erosion
Shoreline retreat impacting foundations, infrastructure, and access routes.
coastal_erosion
Risks
Ocean Acidification
Changes in ocean pH impacting marine ecosystems and ocean-dependent operations.
ocean_acidification
KPI
Historical Temperature
Historical analysis of mean, max and min temperatures over time
temperature_historicalDocumentation
KPI
Future Temperature
Climate temperature projections based on SSP scenarios
temperature_futureDocumentation
KPI
Rainfall
Rainfall precipitation analysis over time
rainDocumentation
KPI
Weather Distribution
Distribution of weather codes and atmospheric conditions
weather_distributionDocumentation
KPI
Cloud Cover
Cloud cover mean analysis over time
historical_cloud_coverDocumentation
KPI
Evapotranspiration
FAO reference evapotranspiration analysis over time
historical_evapotranspirationDocumentation
KPI
Snow
Snowfall precipitation analysis over time
historical_snowfallDocumentation
KPI
Apparent Temperature
Apparent (feels-like) temperature mean, max and min analysis over time
historical_apparent_temperatureDocumentation
KPI
Daylight Duration
Daylight duration analysis over time
historical_daylight_durationDocumentation
KPI
Sunshine Duration
Actual sunshine hours analysis over time
historical_sunshine_durationDocumentation
KPI
Wind Gusts
Wind gusts mean, max and min analysis over time
historical_wind_gustsDocumentation
KPI
Shortwave Radiation
Shortwave solar radiation analysis over time
historical_shortwave_radiationDocumentation
KPI
Dew Point
Dew point mean, max and min analysis over time
historical_dew_pointDocumentation
KPI
Relative Humidity
Relative humidity mean, max and min analysis over time
historical_relative_humidityDocumentation
KPI
Atmospheric Pressure
Atmospheric pressure (MSL) mean, max and min analysis over time
historical_pressureDocumentation
KPI
Wet Bulb Temperature
Wet bulb temperature mean, max and min analysis over time
historical_wet_bulb_temperatureDocumentation
KPI
Soil Moisture
Soil moisture analysis at various depths over time
historical_soil_moistureDocumentation
KPI
Soil Temperature
Soil temperature analysis at various depths over time
historical_soil_temperatureDocumentation
KPI
River Discharge
River discharge analysis over time
river_dischargeDocumentation
KPI
PM10
PM10 particulate matter analysis over time
pm10Documentation
KPI
PM2.5
PM2.5 fine particulate matter analysis over time
pm2_5Documentation
KPI
Carbon Dioxide
Carbon dioxide (CO2) concentration analysis over time
carbon_dioxideDocumentation
KPI
Sulphur Dioxide
Sulphur dioxide (SO2) concentration analysis over time
sulphur_dioxideDocumentation
KPI
Aerosol Optical Depth
Aerosol optical depth (AOD) analysis over time
aerosol_optical_depthDocumentation
KPI
Dust
Dust concentration analysis over time
dustDocumentation
KPI
UV Index
Ultraviolet radiation index analysis over time
uv_indexDocumentation
KPI
UV Index Clear Sky
UV index under clear sky conditions analysis over time
uv_index_clear_skyDocumentation
KPI
European Air Quality Index
European Air Quality Index (EAQI) analysis over time
european_aqiDocumentation
KPI
US Air Quality Index
US Air Quality Index (US AQI) analysis over time
us_aqiDocumentation
KPI
Landslides
Landslide and erosion risk assessment based on past events
landslidesDocumentation
KPI
Distances
Distances from geographical features and urban centres
distancesDocumentation
KPI
Protected Areas Index
KPI based on proximity and coverage of protected areas
protected_areas_indexDocumentation
KPI
Historical Precipitations
Historical analysis of total, mean and max precipitations over time
precipitation_historicalDocumentation
KPI
Future Precipitations
Climate precipitations projections based on SSP scenarios
precipitation_futureDocumentation
KPI
Annual Wind
Wind speed and direction analysis for the year
wind_yearDocumentation
KPI
Historical Temperature
Historical analysis of mean, max and min temperatures over time
historical_temperatureDocumentation
KPI
Historical Precipitations
Historical analysis of total precipitations over time
historical_precipitationDocumentation
KPI
Historical Rainfall
Historical rainfall precipitation analysis over time
historical_rainDocumentation
KPI
Historical Wind Speed
Historical wind speed mean, max and min analysis over time
historical_wind_speedDocumentation
KPI
Historical Soil Moisture (0-7 cm)
Historical soil moisture analysis at 0-7 cm depth
historical_soil_moisture_0_to_7cmDocumentation
KPI
Historical Soil Moisture (7-28 cm)
Historical soil moisture analysis at 7-28 cm depth
historical_soil_moisture_7_to_28cmDocumentation
KPI
Historical Soil Moisture (28-100 cm)
Historical soil moisture analysis at 28-100 cm depth
historical_soil_moisture_28_to_100cmDocumentation
KPI
Historical Soil Moisture (0-100 cm)
Historical soil moisture analysis at 0-100 cm depth
historical_soil_moisture_0_to_100cmDocumentation
KPI
Historical Soil Temperature (0-7 cm)
Historical soil temperature analysis at 0-7 cm depth
historical_soil_temperature_0_to_7cmDocumentation
KPI
Historical Soil Temperature (7-28 cm)
Historical soil temperature analysis at 7-28 cm depth
historical_soil_temperature_7_to_28cmDocumentation
KPI
Historical Soil Temperature (28-100 cm)
Historical soil temperature analysis at 28-100 cm depth
historical_soil_temperature_28_to_100cmDocumentation
KPI
Historical Soil Temperature (0-100 cm)
Historical soil temperature analysis at 0-100 cm depth
historical_soil_temperature_0_to_100cmDocumentation
KPI
Future Temperature
Climate projections of mean, max and min temperature
future_temperatureDocumentation
KPI
Future Precipitations
Climate projections of total precipitations
future_precipitationDocumentation
KPI
Future Rainfall
Climate projections of rainfall precipitation
future_rainDocumentation
KPI
Future Snowfall
Climate projections of snowfall precipitation
future_snowfallDocumentation
KPI
Future Wind Speed
Climate projections of mean and max wind speed
future_wind_speedDocumentation
KPI
Future Shortwave Radiation
Climate projections of shortwave solar radiation
future_shortwave_radiationDocumentation
KPI
Future Evapotranspiration
Climate projections of FAO reference evapotranspiration
future_evapotranspirationDocumentation
KPI
Future Cloud Cover
Climate projections of mean cloud cover
future_cloud_coverDocumentation
KPI
Future Dew Point
Climate projections of mean, max and min dew point
future_dew_pointDocumentation
KPI
Future Relative Humidity
Climate projections of mean, max and min relative humidity
future_relative_humidityDocumentation
KPI
Future Atmospheric Pressure
Climate projections of mean atmospheric pressure
future_pressureDocumentation
KPI
Future Soil Moisture
Climate projections of soil moisture at 0-10 cm depth
future_soil_moistureDocumentation