Back to KPI list Population Density
 Population Density
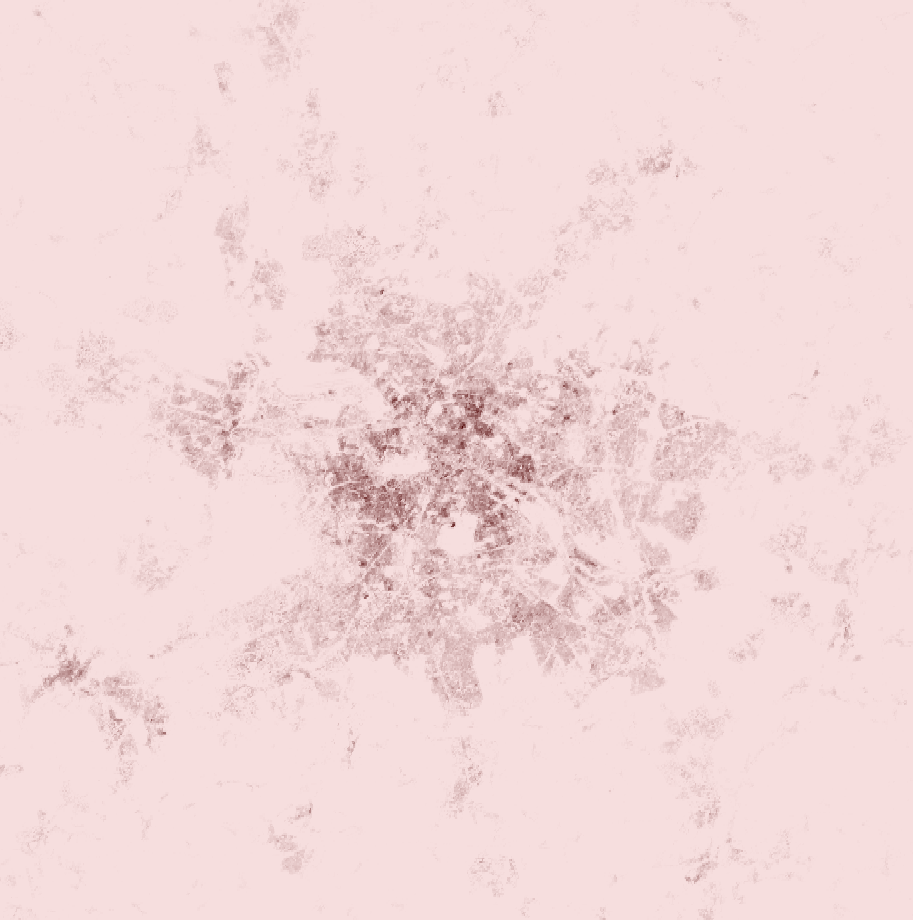 Population Density
 Population Density
Population Density
Urbanizationvv0
Responsible:Niccolò Calandri
Layer Population Density on real sites
Real Estate UK
Catania
Berlino Quarter
Mina el Cerrejon
Population Density
Overview
Population density measures the number of people living in a specific area, expressed in inhabitants per hectare (inh/ha). It is one of the primary indicators of anthropic pressure on the land: high-density areas are associated with soil sealing, reduction of natural habitats, light and noise pollution, ecosystem fragmentation, and increased water stress.
For this reason, the indicator is inverted: a lower population density indicates conditions more favourable for biodiversity and overall environmental quality. The indicator is particularly useful for contextualising the ecological conditions of an area relative to the degree of urbanisation and the cumulative impacts of human activities.
Calculation Methodology
Data are drawn from the GHSL Population Density (Global Human Settlement Layer) grid developed by the Joint Research Centre (JRC) of the European Commission at 100 m resolution. The dataset covers the period 1975–2030 with estimates for every five-year interval, including future projections based on demographic models.
For each polygon, the mean population density within the area is calculated, expressed in inhabitants per hectare. The value is then classified into quality levels according to the defined thresholds.
Unit: inhabitants per hectare (inh/ha)
Data Sources
| Code | Name | Provider | Resolution | Availability |
|---|---|---|---|---|
WRD_GHPOP_99 | GHSL Population Density | JRC / European Commission | 100 m | 1975 — 2030 |
Quality Range and Levels
| Indicator | Unit | Range | Inverted |
|---|---|---|---|
pd | inh/ha | [0, 75, 150, 225, 300, 400] | Yes |
Inverted = Yes: a lower density indicates less anthropic pressure and conditions more favourable for biodiversity.
| Level | Density (inh/ha) | Interpretation |
|---|---|---|
| A (Excellent) | 0 – 75 | Rural area; low anthropic pressure, predominantly natural habitats |
| B (Good) | 75 – 150 | Peri-urban area; moderate pressure, biodiversity partially preserved |
| C (Moderate) | 150 – 225 | Suburban area; significant cumulative impacts on biodiversity |
| D (Poor) | 225 – 300 | Dense urban area; strong anthropic pressure on ecosystems |
| E (Critical) | > 300 | Very dense urban area; maximum soil sealing and habitat loss |
Technical Notes
- The 100 m resolution allows fine-grained analysis even for small polygons
- The dataset covers 1975–2030: historical trends and future density projections can be analysed
- Values for future years (e.g. 2025, 2030) are projections based on demographic models
- The indicator is most discriminative in urban-rural transition zones
References
- Pesaresi, M. et al. (2024). "Advances on the Global Human Settlement Layer by joint assessment of Earth Observation and population survey data". International Journal of Digital Earth.
- UN DESA (2018). "World Urbanization Prospects: The 2018 Revision". United Nations, Department of Economic and Social Affairs.
Quality Ranges and Levels
pd
(ha)ACritical
BLow
CModerate
DGood
EExcellent
0 → 74.99
75 → 149.99
150 → 224.99
225 → 299.99
300 → 400
A
Critical0 – 74.99B
Low75 – 149.99C
Moderate150 – 224.99D
Good225 – 299.99E
Excellent300 – 400Data Sources & References
Sources
WRD_GHPOP_99
Methodology
Mean population density (GHSL GHS-POP, JRC, 100 m) within the polygon, expressed in inhabitants per hectare. The dataset covers 1975–2030 with five-year estimates; values for future years are demographic projections. Inverted indicator: lower density = less anthropic pressure = better for biodiversity.