




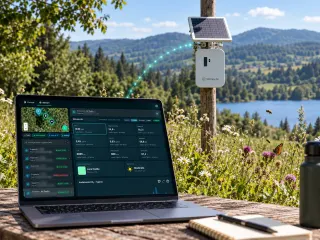


XN FireSight · Wildfire risk
A site's wildfire risk, in a real report to browse.
How often the weather makes vegetation ready to burn, and how much burnable vegetation surrounds the site: the XN FireSight report measures both, with the Italian and EU rules that give the numbers their meaning. Here you browse it page by page, on the public demo site in Como.
It is decision support: it is not the register of burnt land and it does not replace Civil Protection. If you see smoke or flames, call 112.
The XNatura AI assistant answers straight away and books the call for you.
How to read wildfire risk
Two questions: how often the weather favours fire, and what around the site can carry it there.
A site's wildfire risk depends on two things: how often the weather makes vegetation ready to burn, and how much burnable vegetation surrounds it. The report measures both with the platform's data and reads them with published methods.
The weather
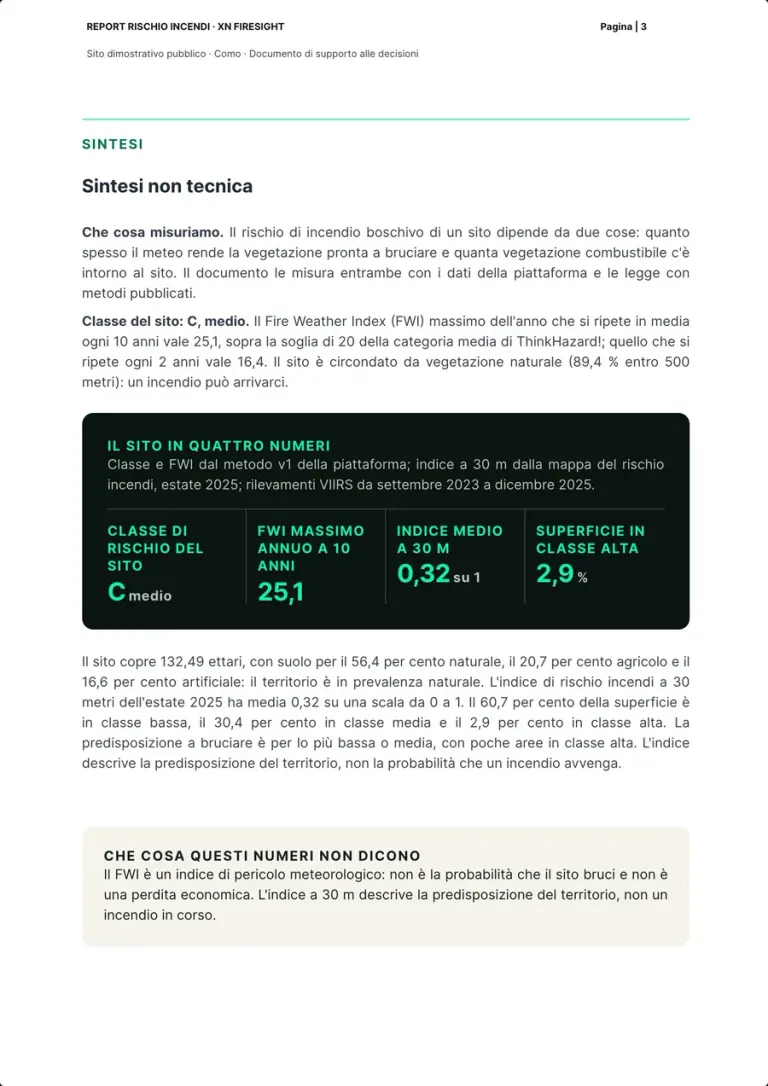
The Fire Weather Index combines temperature, humidity, wind and rain: the higher it is, the more the weather favours ignition. On the Como site the annual maximum that recurs on average every 10 years is 25.1.
Report, p. 12
The vegetation around
Within 500 m of the site 89.4% is natural vegetation: the site is in the intermix, where houses and woodland meet, and a fire can reach it.
Report, pp. 12 and 13
The site in four numbers
- CmediumSite risk class, the platform's method v1
- 25.1Annual maximum FWI, 10-year return
- 0.32of 1Mean 30 m index, summer 2025
- 2.9%Share of the site in the high class
Public demo site in Como, 132.49 hectares. Report, p. 3.
The report, page by page
From the fact sheet to the sources, twenty-nine real pages.
The pages are real: they come from the Report Rischio Incendi · XN FireSight generated with the platform on 9 October 2026 on the public demo site in Como, 132.49 hectares, already public on ilovenatura.com. No client, no owner, no assignment. The pages are in Italian. For each section: what the rules and the sources ask, how the report shows it and who does it.
Report Rischio Incendi · XN FireSight (wildfire risk report), generated with the platform, public demo site in Como (Lombardy, Italy) · 30 numbered pages plus the cover, in Italian, PDF not public
Where each section comes from
- Measured by the platform
- Prepared by our team
- Left to the company or the authorities
17 sections out of 29 measured by the platform, 12 prepared by our team from the rules and the sources. The register and its constraints, the emergency and compliance stay with the municipality, the authorities and the company.
Summary01 / 29
What this document is
- Measured by the platform
- Prepared by our team
What the rules and the sources ask
To do no significant harm to climate adaptation, the Taxonomy asks for a screening of physical risks over the activity's expected lifetime, an assessment of their materiality and of adaptation solutions (Delegated Regulation (EU) 2021/2139, Annex I, Appendix A, Section I).
How the report shows it
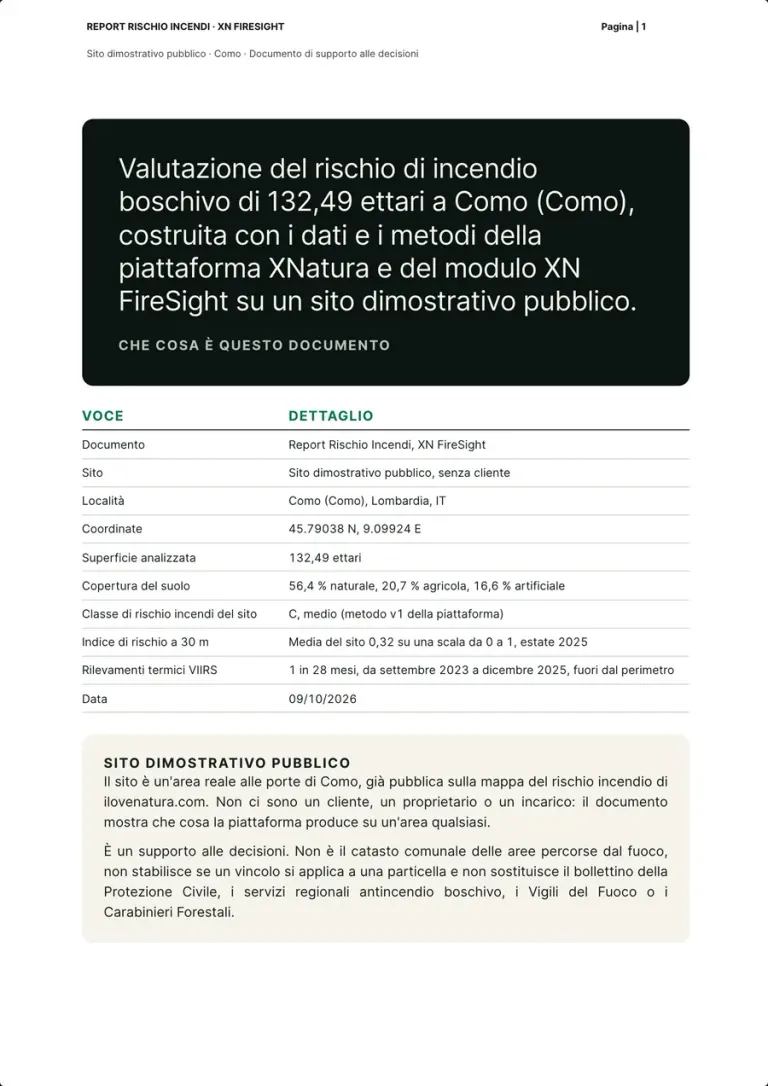
A dark box says what it is: the wildfire risk assessment of 132.49 hectares in Como, built with the data and methods of the platform and of the XN FireSight module, on a public demo site. Then the fact sheet: coordinates 45.79038 N, 9.09924 E, land 56.4% natural, 20.7% agricultural and 16.6% artificial, class C, mean 30 m index 0.32 in summer 2025, one VIIRS detection in 28 months, date 09/10/2026. At the bottom: no client, decision support, not the register of burnt land.
Who does it XNatura platform and team
Real page · public demo site in Como · p. 1/30 Summary02 / 29
The summary: class C and four numbers
- Prepared by our team
- Measured by the platform
What the rules and the sources ask
The Canadian Fire Weather Index is a meteorological index of fuel moisture and of the weather's effects on fire behaviour: the higher it is, the more conditions favour ignition (Copernicus Climate Data Store, fire danger indicators).
How the report shows it
The risk depends on two things: how often the weather makes vegetation ready to burn and how much burnable vegetation is around. The annual maximum FWI that recurs on average every 10 years is 25.1, the 2-year one 16.4, and 89.4% within 500 m is natural vegetation: class C, medium. A box with four numbers, class C, FWI 25.1, 30 m index 0.32 of 1, 2.9% in the high class, and one with what the numbers do not say.
Who does it Our team, on the platform's data
Real page · public demo site in Como · p. 3/30 Site and land cover03 / 29
The site's perimeter
- Measured by the platform
What the rules and the sources ask
Urban-rural interface zones are those where houses or other man-made structures are closely interconnected with natural areas or burnable vegetation (Law 353/2000, art. 2(1-bis)).
How the report shows it
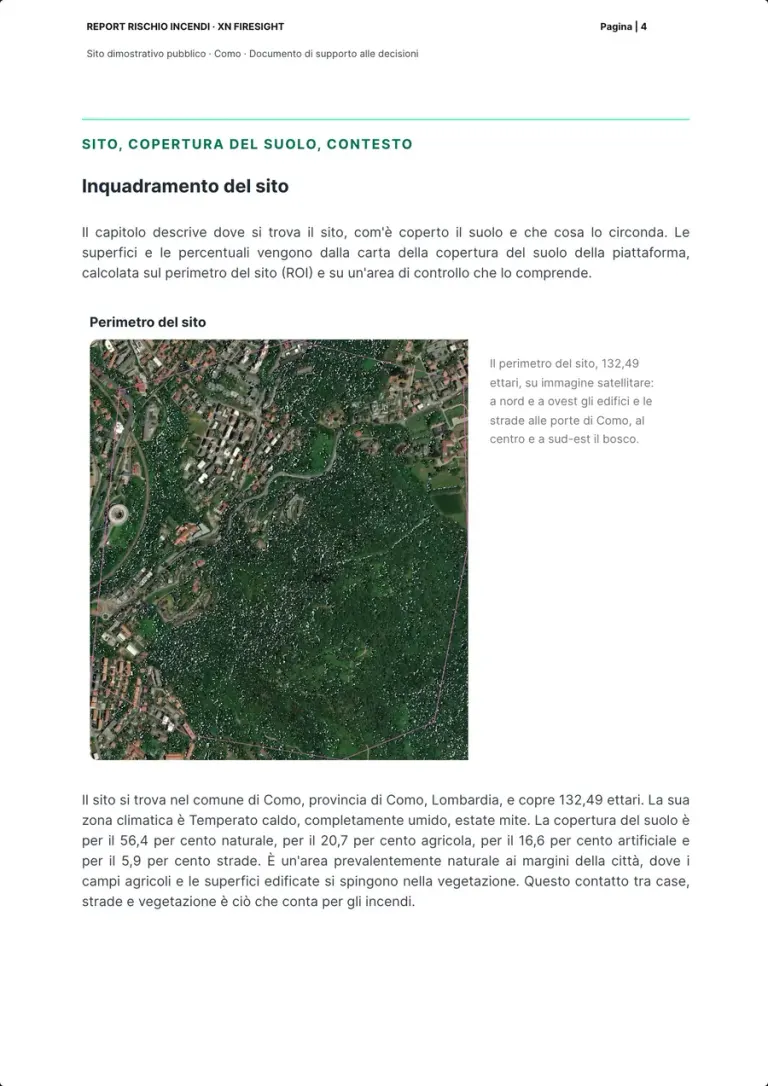
The 132.49-hectare perimeter on a satellite image: buildings and roads on the edge of Como to the north and west, woodland in the centre and to the south-east. The text places it in the municipality of Como, in a warm temperate, fully humid climate with a mild summer, and gives its land cover: 56.4% natural, 20.7% agricultural, 16.6% artificial, 5.9% roads. The contact between houses, roads and vegetation is what matters for fire.
Who does it XNatura platform
Real page · public demo site in Como · p. 4/30 Site and land cover04 / 29
Land cover of the site and of the control area
- Measured by the platform
What the rules and the sources ask
The regional wildfire plan maps the risk areas and lists the fuel-reduction works (Law 353/2000, art. 3(3)).
How the report shows it
The table by main class: on the site 74.74 hectares natural (56.4%), 27.45 agricultural (20.7%), 22.03 artificial (16.6%), 7.84 of roads and 0.44 of water; the 141.25-hectare control area is 49.9% natural and 29.2% artificial. Below, the map: natural in green, agricultural in yellow, artificial in grey, roads in red, from the platform's land cover map, which combines nine sources including Corine Land Cover 2018 and ESA WorldCover 2021.
Who does it XNatura platform
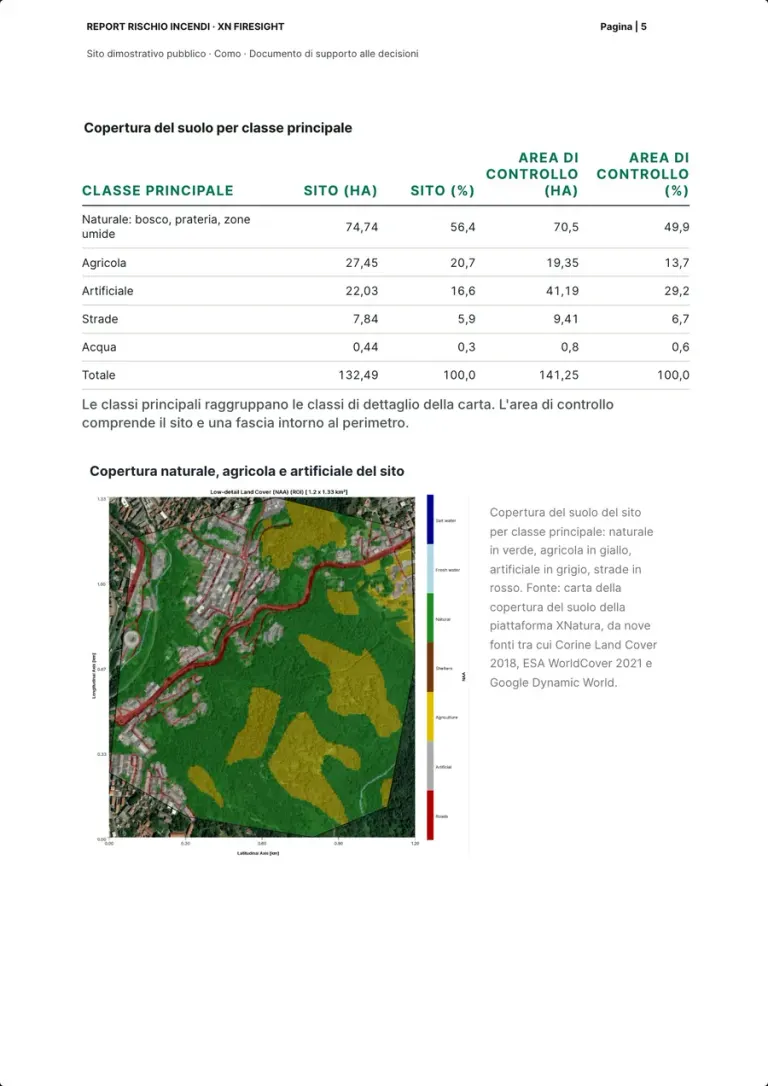
Real page · public demo site in Como · p. 5/30 Site and land cover05 / 29
Towns, streams and lakes around
- Measured by the platform
What the rules and the sources ask
The regional plan sets the forbidden actions and the duties in the risk areas and periods, also for the urban-rural interface (Law 353/2000, art. 3(3)(f)).
How the report shows it
Distances from the site: the towns of Lipomo at 1.2 km, Capiago at 1.8, Ponzate and Civiglio at 1.9; the Segrada and Fiume Aperto streams at 0 m, the Respaù torrent at 0.6 km; Lake Montorfano at 2.1 km, Lake Como at 2.3, Lake Alserio at 7.6.
Who does it XNatura platform
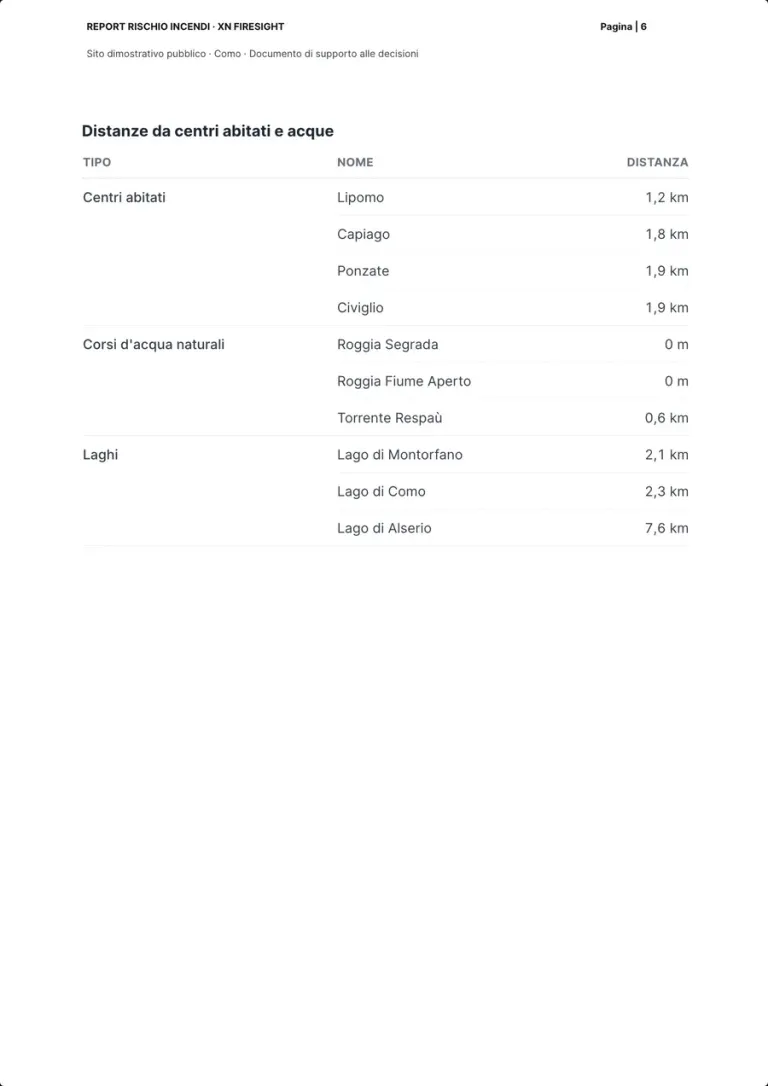
Real page · public demo site in Como · p. 6/30 The rules06 / 29
The constraints on burnt land
- Prepared by our team
- Left to the company or the authorities
What the rules and the sources ask
In woodland and pasture burnt by fire the land use cannot change for at least 15 years, and building is banned for 10 years, unless the planning instruments in force before the fire already provided for it (Law 353/2000, art. 10(1)).
How the report shows it
A table with what, rule and duration: land use 15 years; deeds of sale, which must recall the constraint or be void, 15 years; building 10 years; publicly funded reforestation 5 years; grazing and hunting 10 years; undergrowth products 3 years. The source is the text in force on Normattiva, updated to 8 November 2021; breaching the building ban brings the penalties of Law 47/1985 and demolition (art. 10(4)).
Who does it Our team, on the text in force; the constraint comes from the municipal register
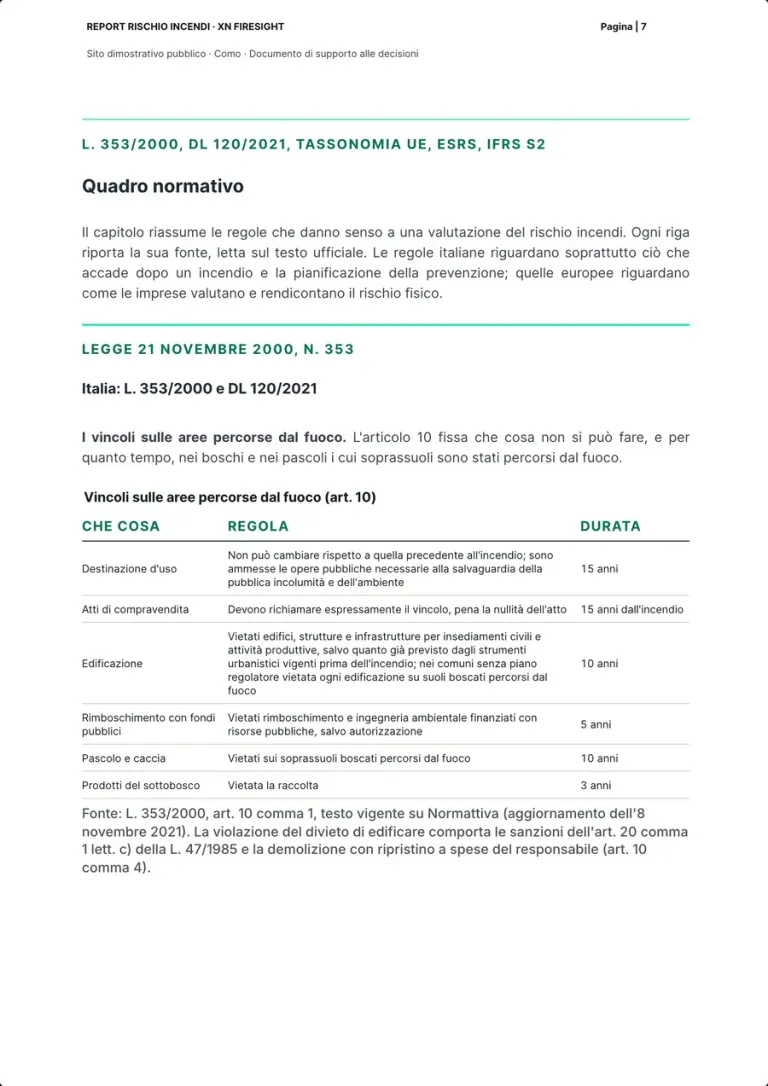
Real page · public demo site in Como · p. 7/30 The rules07 / 29
Register, bans, regional plan and bulletin
- Prepared by our team
- Left to the company or the authorities
What the rules and the sources ask
Municipalities record in a register (catasto) the land burnt in the last five years and update it every year: the list is posted for 30 days for observations and the final lists are approved within 60 days (Law 353/2000, art. 10(2)).
How the report shows it
The municipal register and its updates; the bans in the risk areas and periods, with fines from EUR 5,000 to 50,000, which apply to anyone, companies included; the regional wildfire plan, reviewed every year; the urban-rural interface; the amendments of Decree-Law 120 of 2021; the daily Civil Protection bulletin on three levels, at provincial scale. A box: the constraint comes from the register the municipality approves, not from a satellite map, and the document does not say whether a parcel is constrained.
Who does it Our team; the municipality approves the register
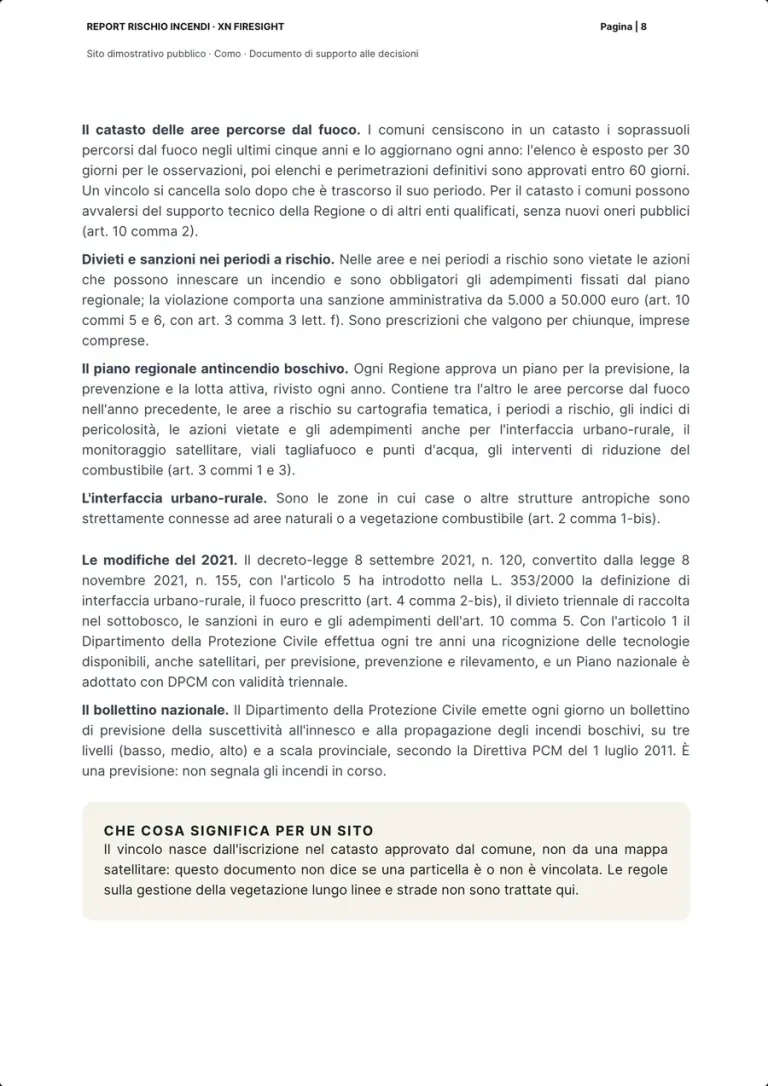
Real page · public demo site in Como · p. 8/30 The rules08 / 29
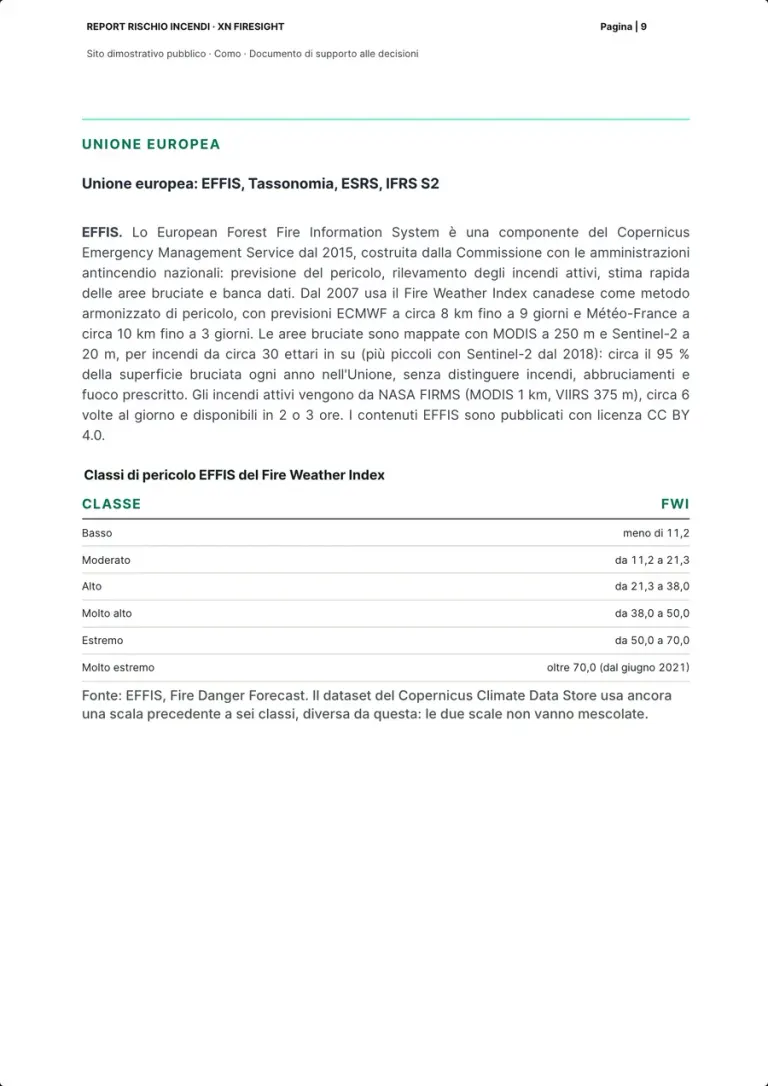
EFFIS and the European FWI classes
- Prepared by our team
What the rules and the sources ask
In 2007 EFFIS adopted the Canadian Fire Weather Index as its harmonised danger method; its classes run from low, below 11.2, to very extreme, above 70.0 (EFFIS, technical background).
How the report shows it
EFFIS, a component of the Copernicus Emergency Management Service since 2015, set up by the Commission with the national fire administrations, has used the Canadian FWI since 2007. The table of its six classes: low below 11.2, moderate from 11.2 to 21.3, high up to 38.0, very high up to 50.0, extreme up to 70.0, very extreme above 70.0, since June 2021. Below, the warning: the Climate Data Store still uses an older scale, and the two scales must not be mixed.
Who does it Our team, on the EFFIS pages
Real page · public demo site in Como · p. 9/30 The rules09 / 29
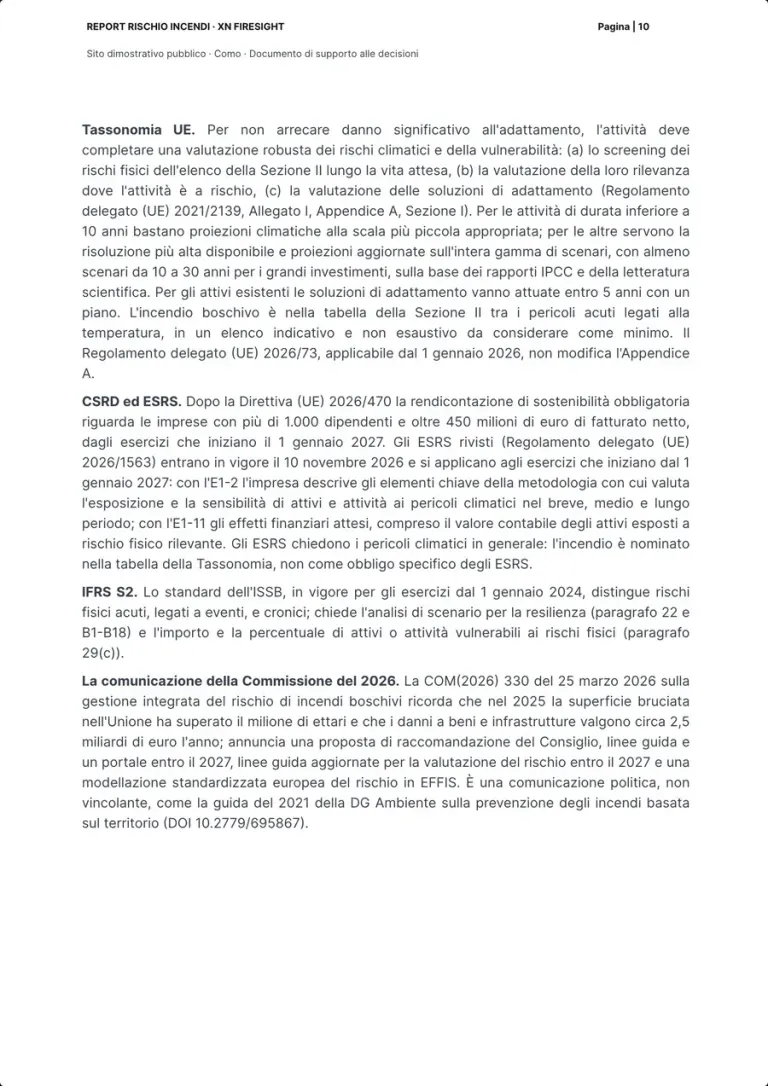
Taxonomy, CSRD and ESRS, IFRS S2, the Commission
- Prepared by our team
What the rules and the sources ask
Wildfire is listed in the Section II table among the acute, temperature-related hazards, in an indicative, non-exhaustive list to be taken into account as a minimum (Delegated Regulation (EU) 2021/2139, Annex I, Appendix A, Section II).
How the report shows it
The Taxonomy's climate risk assessment in three steps, screening, materiality, solutions, with 10 to 30-year scenarios for major investments and solutions within 5 years for existing assets; Regulation 2026/73 does not amend Appendix A. Mandatory reporting after Directive 2026/470: companies with more than 1,000 employees and 450 million of turnover, from 2027. The revised ESRS, in force on 10 November 2026; IFRS S2, paragraphs 22 and 29(c); COM(2026) 330, a non-binding communication.
Who does it Our team, on the official texts
Real page · public demo site in Como · p. 10/30 The rules10 / 29
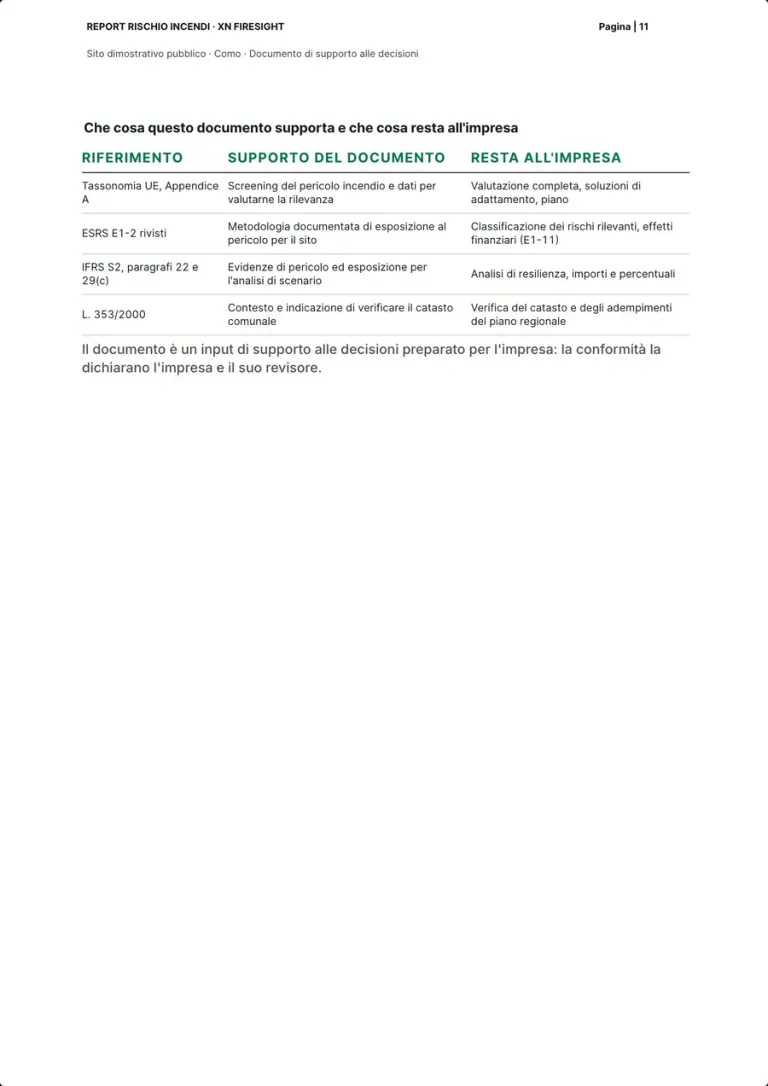
What the document supports and what stays with the company
- Prepared by our team
- Left to the company or the authorities
What the rules and the sources ask
Under the revised ESRS E1-2 the company discloses the key elements of the methodology it uses to assess how its assets and activities are exposed and sensitive to climate hazards over the short, medium and long term (Delegated Regulation (EU) 2026/1563, ESRS E1).
How the report shows it
Four rows. For Appendix A of the Taxonomy the document gives the hazard screening and the data to assess materiality; the full assessment, the solutions and the plan stay with the company. For ESRS E1-2 a documented methodology; the classification of risks and the financial effects of E1-11 stay with the company. For IFRS S2, paragraphs 22 and 29(c), evidence for scenario analysis. For Law 353/2000 the context and a pointer to check the municipal register.
Who does it Our team; the company and its auditor declare compliance
Real page · public demo site in Como · p. 11/30 The risk class11 / 29
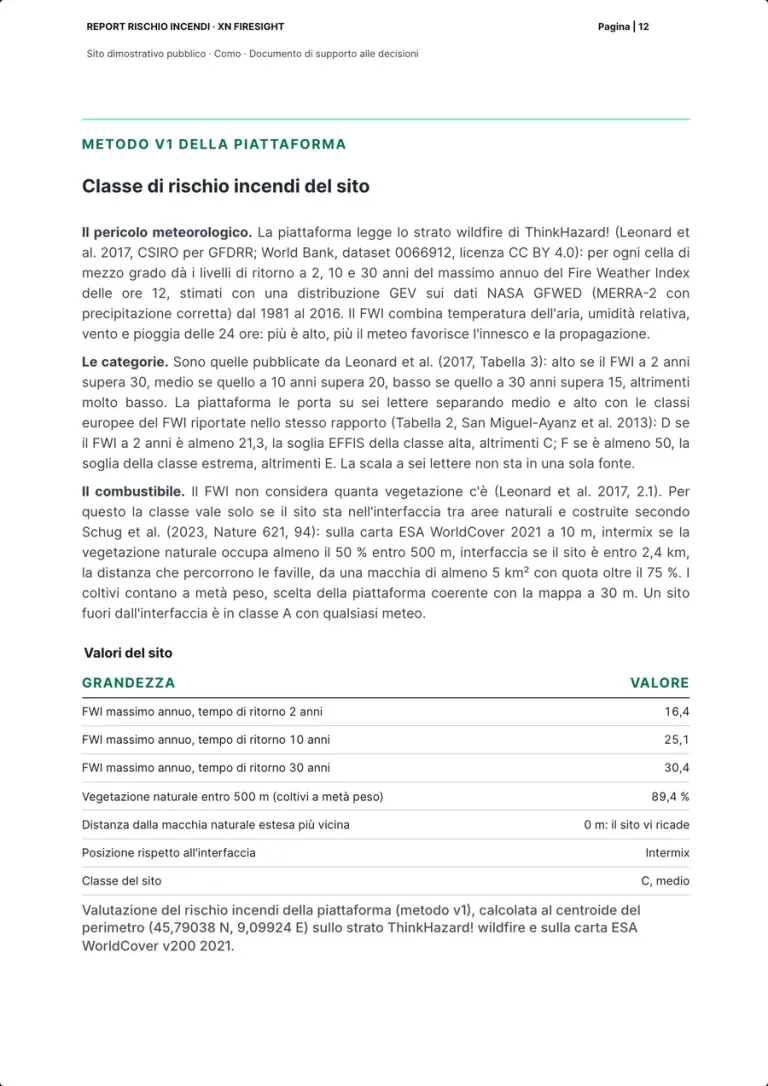
The site's risk class: method v1
- Measured by the platform
- Prepared by our team
What the rules and the sources ask
The FWI is computed from the noon air temperature, relative humidity and wind speed and the 24-hour precipitation (Copernicus, Fire Weather Index).
How the report shows it
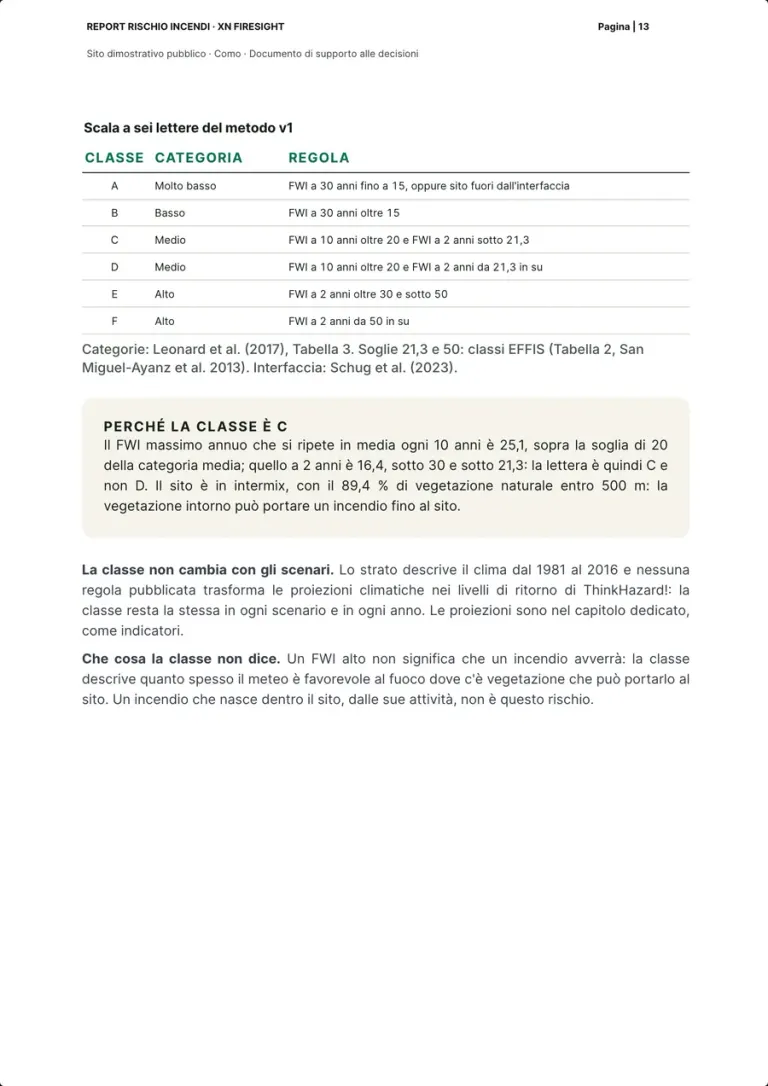
The ThinkHazard! wildfire layer (Leonard et al. 2017, CSIRO for GFDRR) gives, for each half-degree cell, the 2, 10 and 30-year return levels of the annual maximum FWI, from data from 1981 to 2016; the categories are those of Leonard's Table 3. The FWI ignores vegetation, so the class holds only if the site is in the interface as defined by Schug et al. (2023). The site's values: FWI 16.4, 25.1 and 30.4, natural vegetation within 500 m 89.4%, intermix, class C, medium.
Who does it XNatura platform, method v1
Real page · public demo site in Como · p. 12/30 The risk class12 / 29
The six-letter scale, and why the class is C
- Prepared by our team
What the rules and the sources ask
The EFFIS FWI classes have thresholds at 11.2, 21.3, 38.0, 50.0 and 70.0; the Climate Data Store dataset still uses an older scale, and the two scales must not be mixed (EFFIS; Copernicus Climate Data Store).
How the report shows it
The table of the six letters: A very low, B low, C and D medium, E and F high, with the thresholds 15, 20 and 30 of Leonard et al. (2017, Table 3) and the thresholds 21.3 and 50 of the EFFIS classes, which split C from D and E from F. Why C: the 10-year FWI is 25.1, above 20; the 2-year one is 16.4, below 30 and below 21.3; the site is in the intermix, with 89.4% natural vegetation within 500 m. The class stays the same in every scenario.
Who does it Our team, on the platform's method
Real page · public demo site in Como · p. 13/30 The 30 m map13 / 29
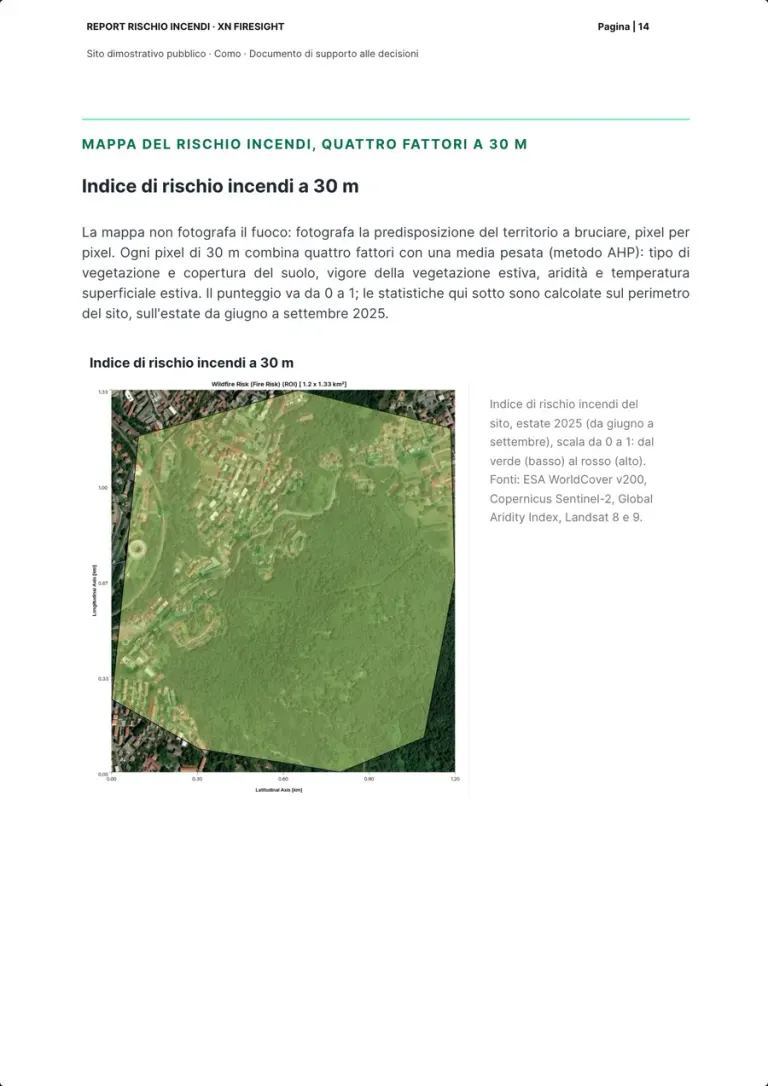
The 30 m wildfire risk index
- Measured by the platform
What the rules and the sources ask
The regional wildfire plan maps the risk areas and states the risk periods and the danger indices (Law 353/2000, art. 3(3)).
How the report shows it
The map does not picture fire: it shows how prone the land is to burn. Each 30 m pixel combines four factors with a weighted mean (AHP method): land cover, summer vegetation vigour, aridity and summer land surface temperature. A score from 0 to 1 over the site's perimeter, summer from June to September 2025, from green to red; sources ESA WorldCover v200, Copernicus Sentinel-2, Global Aridity Index, Landsat 8 and 9.
Who does it XNatura platform
Real page · public demo site in Como · p. 14/30 The 30 m map14 / 29
The index classes and the four factors
- Measured by the platform
- Prepared by our team
What the rules and the sources ask
The assessment of physical risks draws on the best available science: IPCC reports, peer-reviewed literature, open-source or paid models (Delegated Regulation (EU) 2021/2139, Annex I, Appendix A, Section I).
How the report shows it
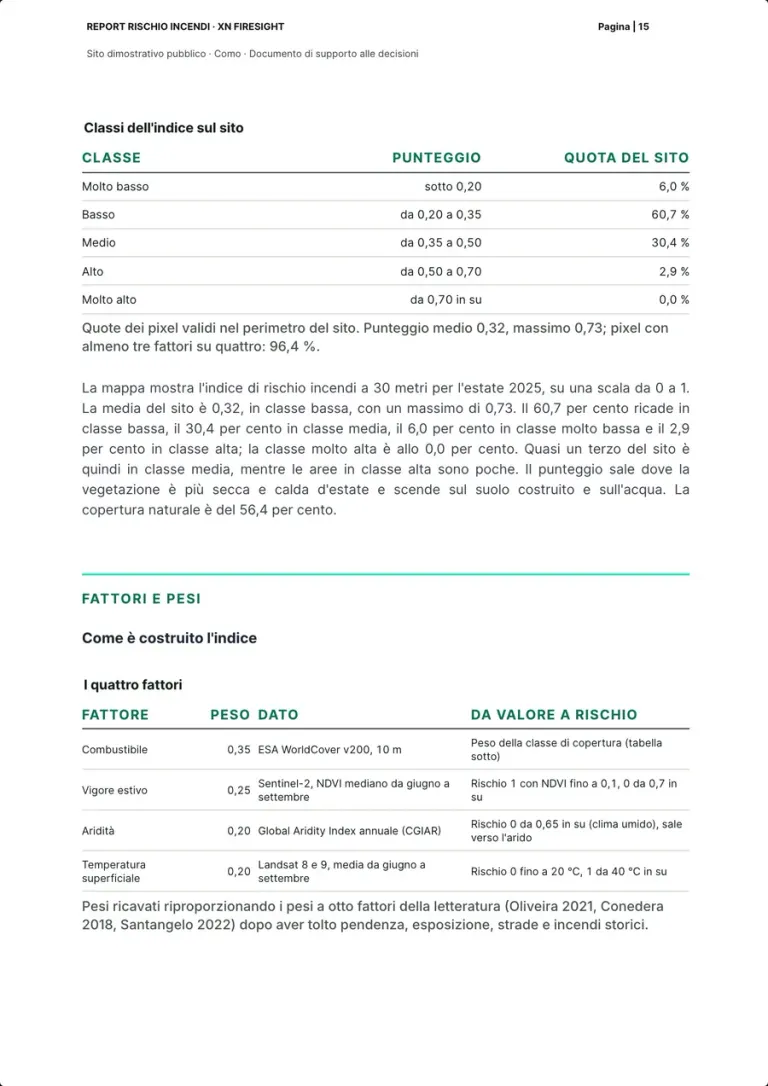
The site's shares by class: very low 6.0%, low 60.7%, medium 30.4%, high 2.9%, very high 0.0%; mean score 0.32, maximum 0.73, and 96.4% of pixels with at least three factors out of four. Then the weights: fuel 0.35 from ESA WorldCover at 10 m, summer vigour 0.25 from Sentinel-2 NDVI, aridity 0.20, land surface temperature 0.20, obtained by rescaling the weights of Oliveira 2021, Conedera 2018 and Santangelo 2022.
Who does it XNatura platform; weights from the literature
Real page · public demo site in Como · p. 15/30 The 30 m map15 / 29
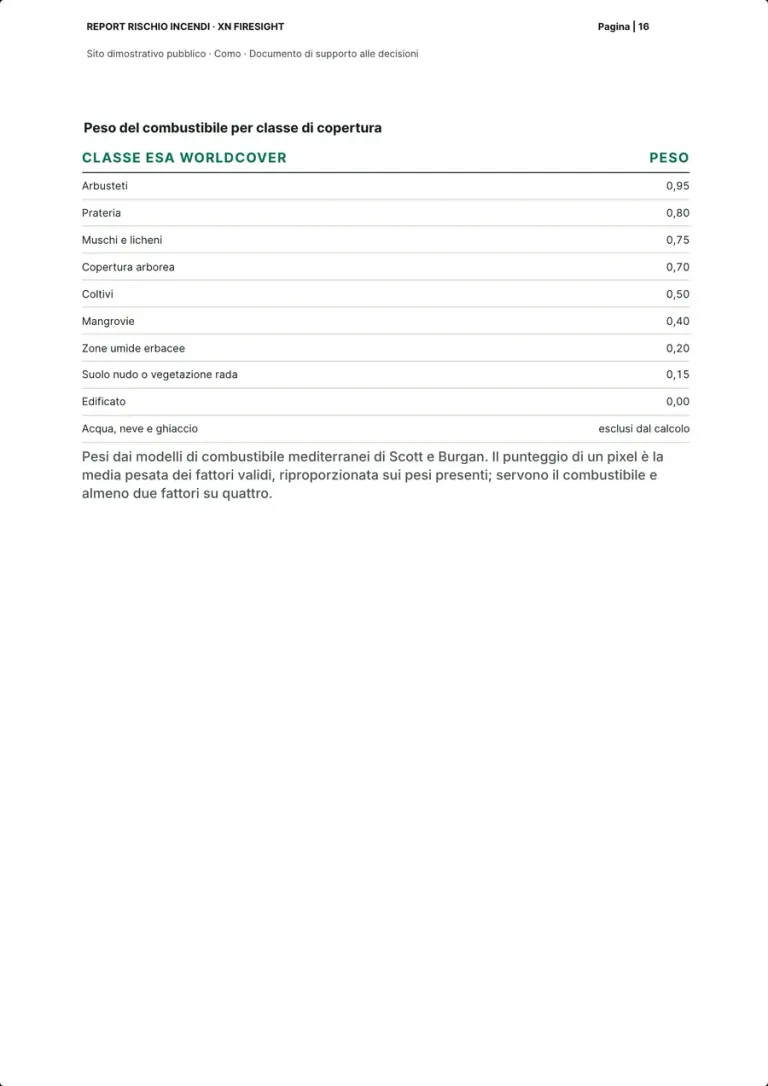
The fuel weight of each land cover class
- Prepared by our team
What the rules and the sources ask
The regional wildfire plan includes the fuel-reduction works (Law 353/2000, art. 3(3)).
How the report shows it
The table of weights by ESA WorldCover class: shrubland 0.95, grassland 0.80, moss and lichen 0.75, tree cover 0.70, cropland 0.50, mangroves 0.40, herbaceous wetland 0.20, bare or sparse vegetation 0.15, built-up 0.00; water, snow and ice excluded. The weights come from the Mediterranean fuel models of Scott and Burgan; a pixel counts if it has the fuel and at least two factors out of four.
Who does it Our team, on the Scott and Burgan models
Real page · public demo site in Como · p. 16/30 Detections16 / 29
Active fires and the record of VIIRS detections
- Measured by the platform
- Left to the company or the authorities
What the rules and the sources ask
Satellite hotspots come from NASA FIRMS, with 375 m pixels for VIIRS, and are available within 2 to 3 hours; small or cloud-covered fires can be missed, and not every hotspot is a fire (EFFIS, active fire detection).
How the report shows it
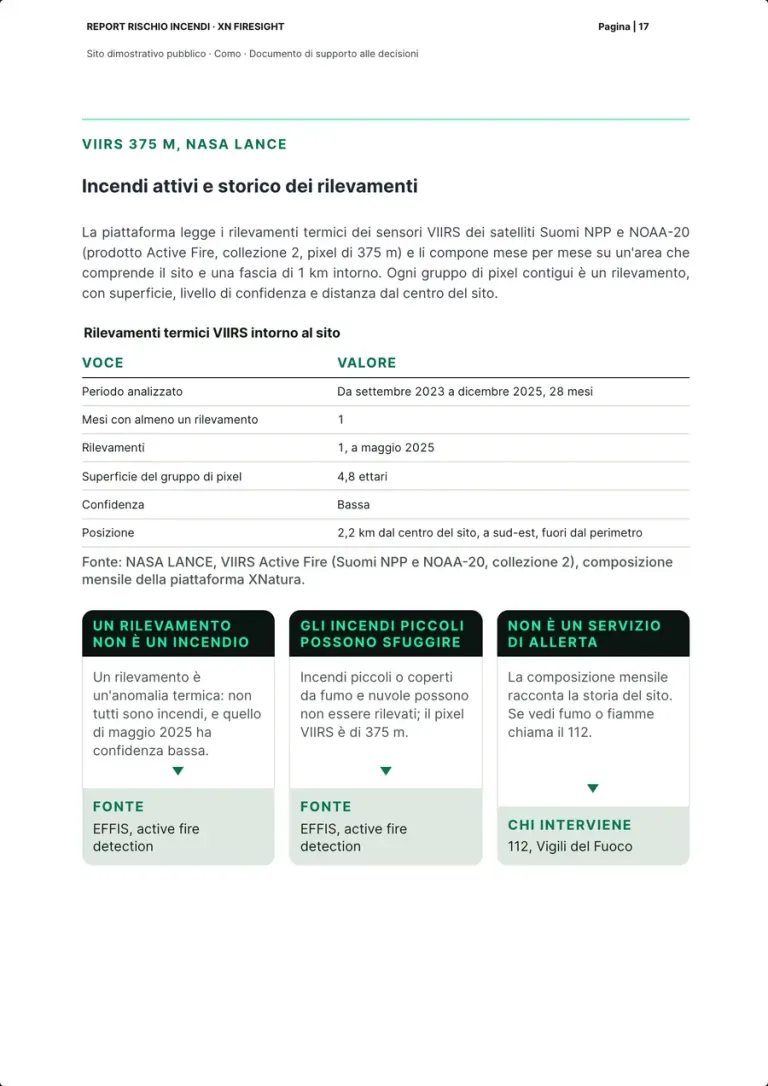
The VIIRS thermal detections of the Suomi NPP and NOAA-20 satellites, 375 m pixels, composited month by month over an area with a 1 km buffer: from September 2023 to December 2025, 28 months, a single detection, in May 2025, a 4.8-hectare cluster of pixels at low confidence, 2.2 km south-east of the centre, outside the perimeter. Three boxes: a detection is not a fire, small fires can be missed, this is not an alert service, and in an emergency you call 112.
Who does it XNatura platform; in an emergency, 112
Real page · public demo site in Como · p. 17/30 Detections17 / 29
The last 30 days
- Measured by the platform
What the rules and the sources ask
EFFIS shows a filtered subset of hotspots, and a hotspot is a thermal anomaly, not a confirmed fire (EFFIS, active fire detection).
How the report shows it
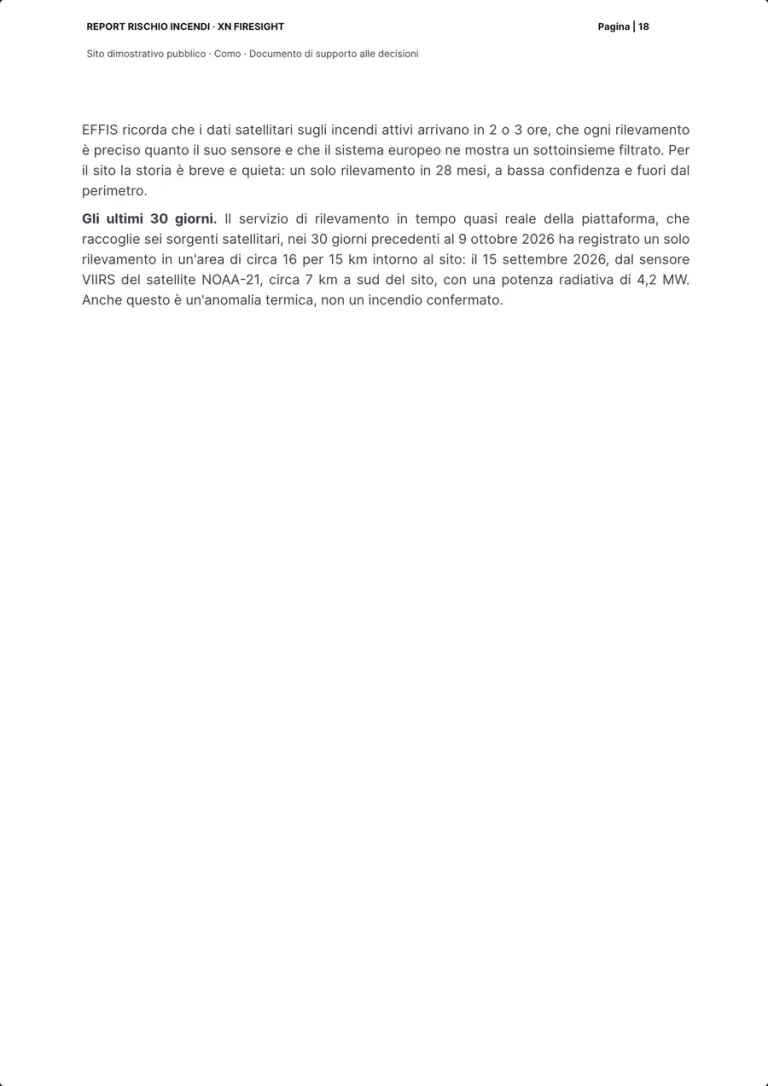
First the EFFIS warning: data arrive within 2 or 3 hours and each detection is only as precise as its sensor; for the site the record is short and quiet, a single detection in 28 months. Then the 30 days before 9 October 2026, over an area of about 16 by 15 km: a single detection, on 15 September 2026, from the VIIRS sensor of the NOAA-21 satellite, about 7 km south of the site, with a radiative power of 4.2 MW. This too is a thermal anomaly, not a confirmed fire.
Who does it XNatura platform
Real page · public demo site in Como · p. 18/30 Fuel and moisture18 / 29
The site's fuel classes
- Measured by the platform
What the rules and the sources ask
For an activity at risk the Taxonomy asks for an assessment of the materiality of the physical risks the screening found (Delegated Regulation (EU) 2021/2139, Annex I, Appendix A, Section I).
How the report shows it
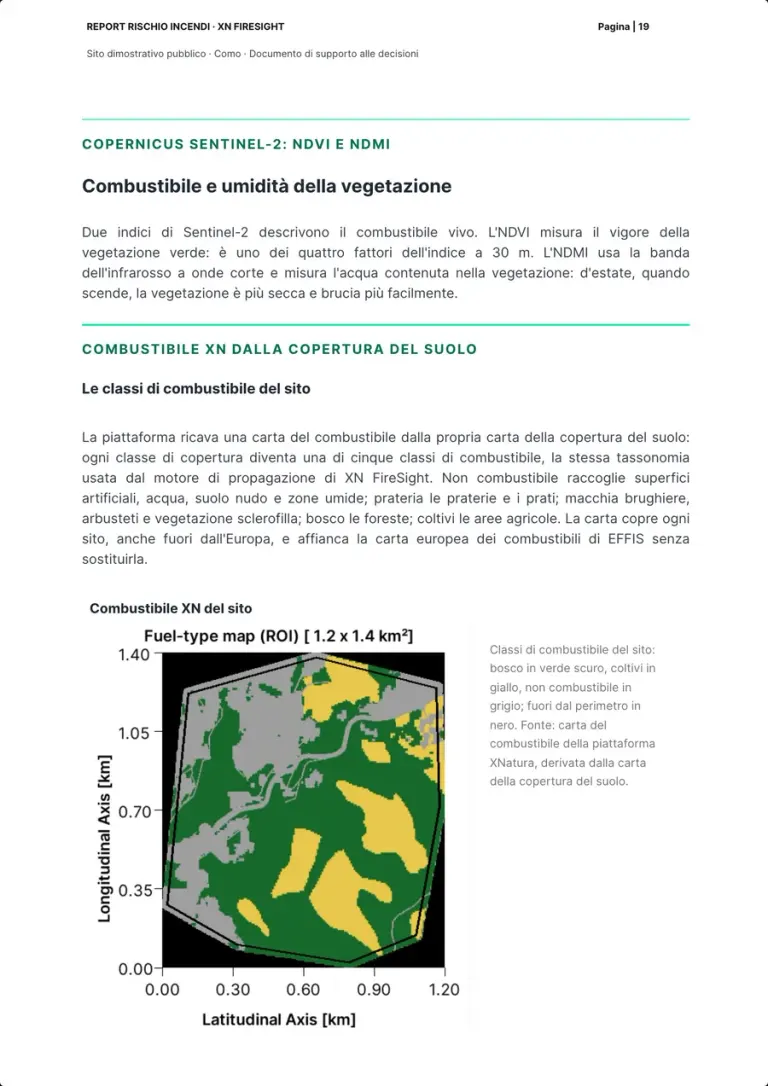
The platform derives a fuel map in five classes from its own land cover map: non-burnable, grassland, shrubland, woodland, cropland. It covers any site, also outside Europe, and complements the EFFIS European fuel map without replacing it. On the map woodland is dark green, cropland yellow, non-burnable grey. The shares by class are not on the page: read on the platform on 9 October 2026, woodland 52.1%, cropland 20.7%, non-burnable 27.2%.
Who does it XNatura platform
Real page · public demo site in Como · p. 19/30 Fuel and moisture19 / 29
NDVI, vegetation vigour
- Measured by the platform
What the rules and the sources ask
The regional wildfire plan also includes the satellite monitoring measures (Law 353/2000, art. 3(3)).
How the report shows it
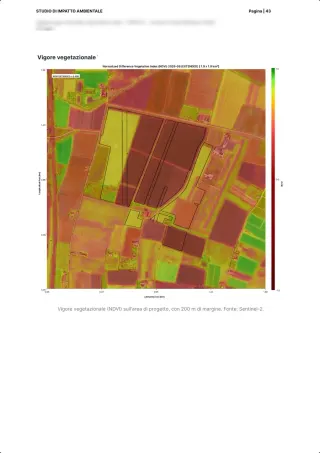
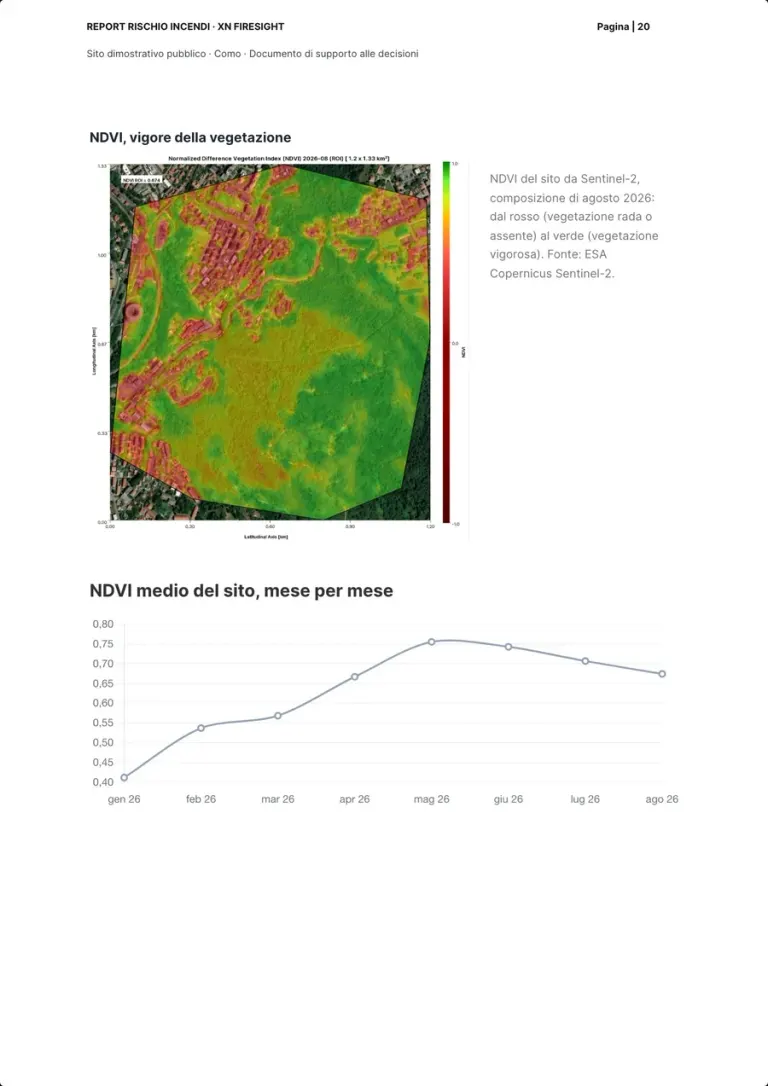
The Sentinel-2 NDVI map, August 2026 composite, from the red of sparse or absent vegetation to the green of vigorous vegetation, with the site's mean value, 0.674, and the month-by-month curve from January to August 2026: it rises to its May peak, then falls through the summer.
Who does it XNatura platform
Real page · public demo site in Como · p. 20/30 Fuel and moisture20 / 29
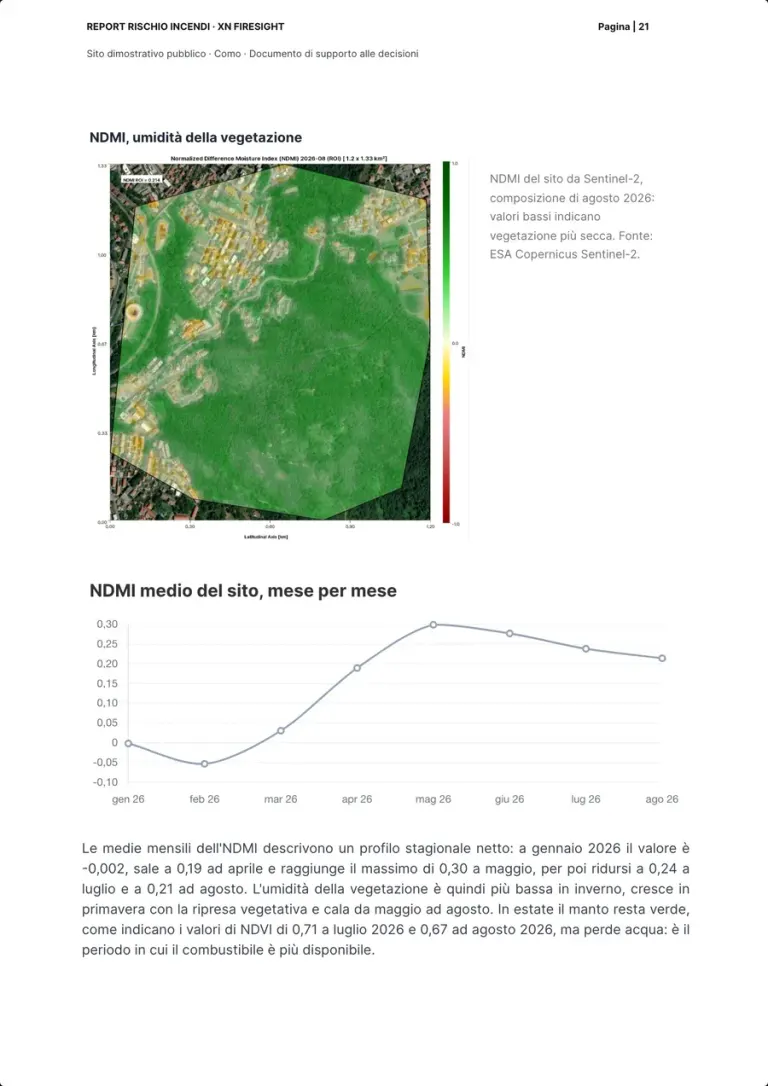
NDMI, vegetation moisture
- Measured by the platform
What the rules and the sources ask
The FWI describes fuel moisture and the weather's effects on fire behaviour (Copernicus Climate Data Store, fire danger indicators).
How the report shows it
The NDMI map of August 2026, where low values mean drier vegetation, and the monthly curve: -0.002 in January, 0.19 in April, a peak of 0.30 in May, then 0.24 in July and 0.21 in August. In summer the canopy stays green, with an NDVI of 0.71 in July and 0.67 in August, but it loses water: this is when fuel is most available.
Who does it XNatura platform
Real page · public demo site in Como · p. 21/30 Temperature and climate21 / 29
Heat stress: land surface temperature
- Measured by the platform
What the rules and the sources ask
Wildfire is one of the acute, temperature-related hazards, next to heat wave and cold wave (Delegated Regulation (EU) 2021/2139, Annex I, Appendix A, Section II).
How the report shows it
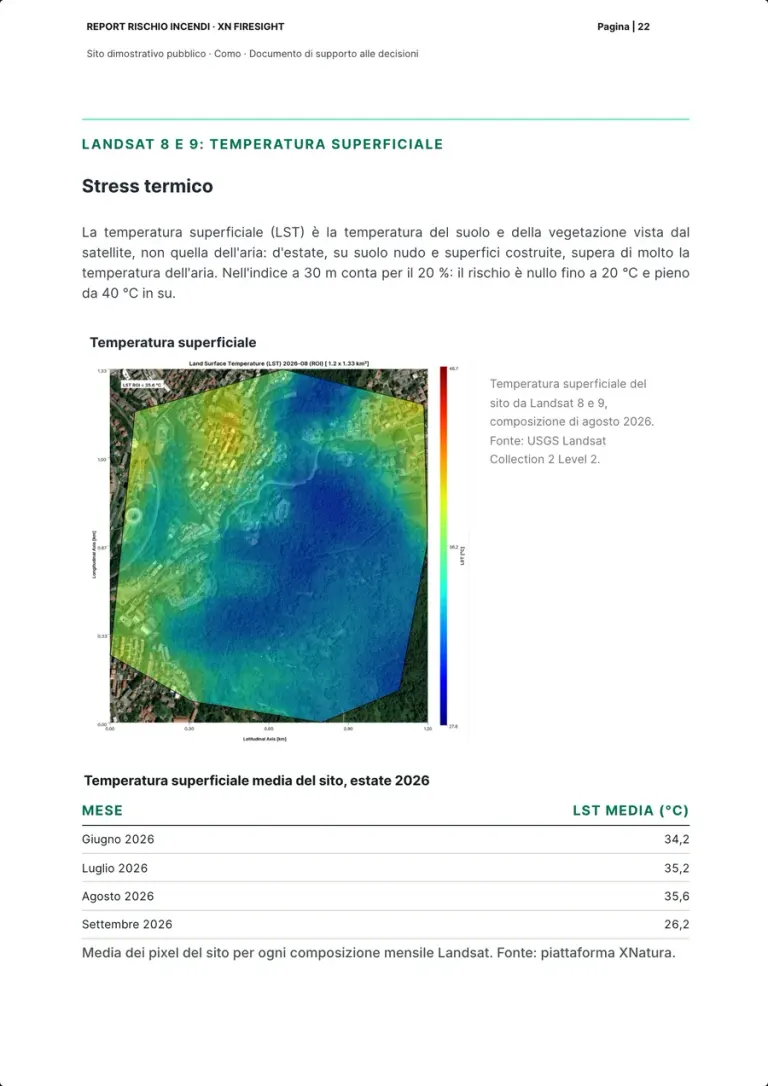
Land surface temperature is the temperature of the ground and vegetation seen from the satellite, not the air's; in the 30 m index it weighs 20%, with no risk up to 20 °C and full risk from 40 °C. The Landsat 8 and 9 map of August 2026 and the site's means: 34.2 °C in June, 35.2 in July, 35.6 in August, 26.2 in September 2026.
Who does it XNatura platform
Real page · public demo site in Como · p. 22/30 Temperature and climate22 / 29
The site's climate series
- Measured by the platform
What the rules and the sources ask
IFRS S2 tells acute physical risks, driven by events such as heatwaves or droughts, from chronic ones (IFRS S2, Appendix A).
How the report shows it
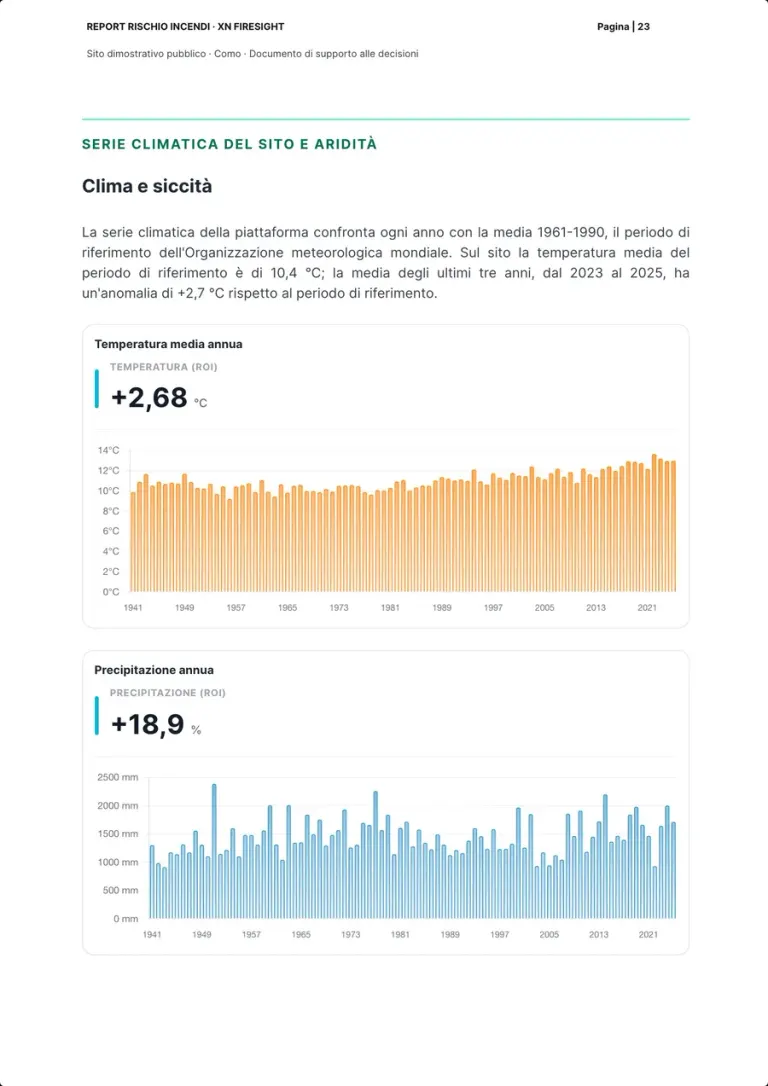
The series compares every year with the 1961-1990 mean, the World Meteorological Organization's reference period: on the site the reference mean temperature is 10.4 °C, and the last three years, from 2023 to 2025, are 2.7 °C above it. Two year-by-year charts from 1941: mean annual temperature, with the value +2.68 °C, and annual precipitation, +18.9%.
Who does it XNatura platform
Real page · public demo site in Como · p. 23/30 Temperature and climate23 / 29
A humid climate, and aridity
- Measured by the platform
- Prepared by our team
What the rules and the sources ask
For activities with a lifespan under 10 years, climate projections at the smallest appropriate scale are enough; for the others, the highest available resolution is needed (Delegated Regulation (EU) 2021/2139, Annex I, Appendix A, Section I).
How the report shows it
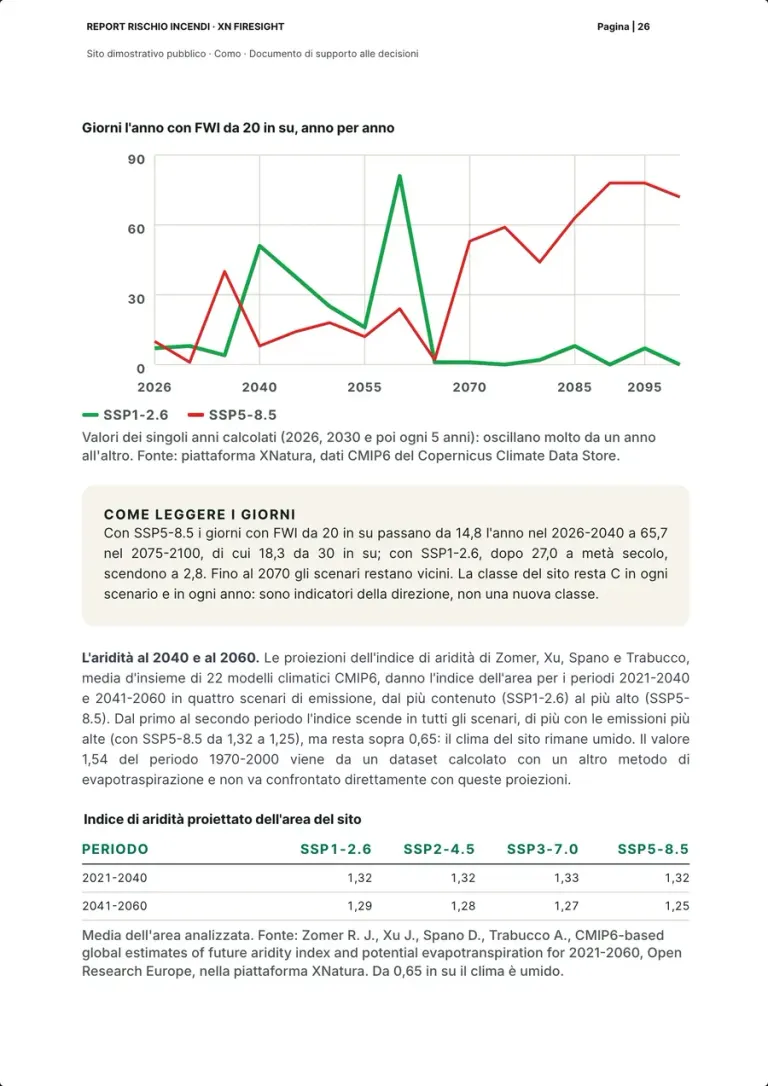
A warm temperate, fully humid climate zone with a mild summer: in the reference period 10.4 degrees and an aridity index of 1.54, a humid climate. In the last three years 2.7 degrees more and 284 millimetres more rain: the site has warmed while staying humid. The aridity index is the ratio of precipitation to potential evapotranspiration: below 0.65 the climate is dry by the UNEP classification; the Global Aridity Index version 3 (Zomer, Xu and Trabucco 2022) describes 1970-2000.
Who does it XNatura platform, from the Global Aridity Index
Real page · public demo site in Como · p. 24/30 Projections24 / 29
Days with FWI of 20 or more, by scenario
- Measured by the platform
- Prepared by our team
What the rules and the sources ask
IFRS S2 asks for climate-related scenario analysis to assess resilience (IFRS S2, paragraph 22 and B1-B18).
How the report shows it
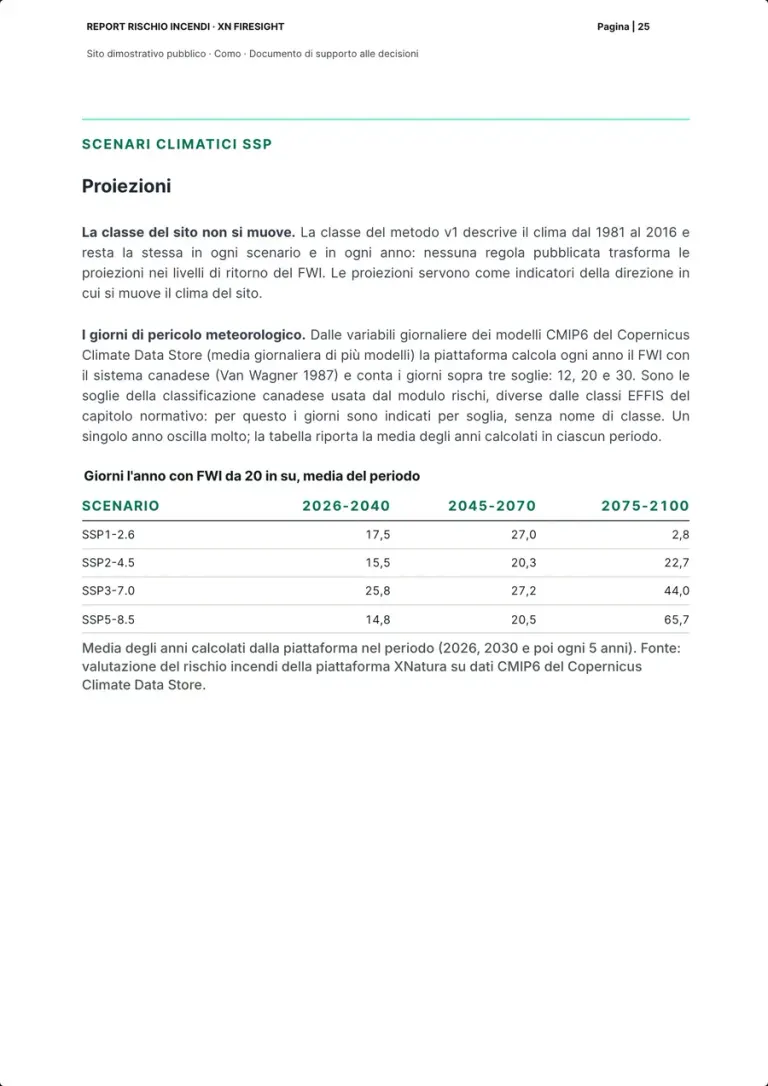
The method v1 class describes the climate from 1981 to 2016 and stays the same in every scenario: the projections are indicators of direction. From the daily CMIP6 variables of the Copernicus Climate Data Store the platform computes the FWI every year (Van Wagner 1987) and counts the days above 12, 20 and 30, Canadian thresholds that differ from the EFFIS classes. Days a year with FWI of 20 or more: under SSP5-8.5 14.8 in 2026-2040, 20.5 in 2045-2070 and 65.7 in 2075-2100; under SSP1-2.6 17.5, 27.0 and 2.8.
Who does it XNatura platform, on CMIP6 data
Real page · public demo site in Como · p. 25/30 Projections25 / 29
Year by year, and aridity in 2040 and 2060
- Measured by the platform
- Prepared by our team
What the rules and the sources ask
For major investments the Taxonomy asks for at least 10 to 30-year scenarios (Delegated Regulation (EU) 2021/2139, Annex I, Appendix A, Section I).
How the report shows it
The chart of days with FWI of 20 or more year by year, SSP1-2.6 against SSP5-8.5: single years swing widely. Under SSP5-8.5 they go from 14.8 to 65.7 days a year, 18.3 of them at 30 or more; under SSP1-2.6, after 27.0 at mid-century, they fall to 2.8, and the class stays C in every scenario. Then the projected aridity index: from 1.32-1.33 in 2021-2040 to 1.29-1.25 in 2041-2060, always above 0.65, a humid climate.
Who does it XNatura platform; projections by Zomer et al.
Real page · public demo site in Como · p. 26/30 XN FireSight and monitoring26 / 29
XN FireSight: prevention and monitoring
- Prepared by our team
What the rules and the sources ask
For existing assets the adaptation solutions must be implemented within 5 years, with an adaptation plan (Delegated Regulation (EU) 2021/2139, Annex I, Appendix A, Section I).
How the report shows it
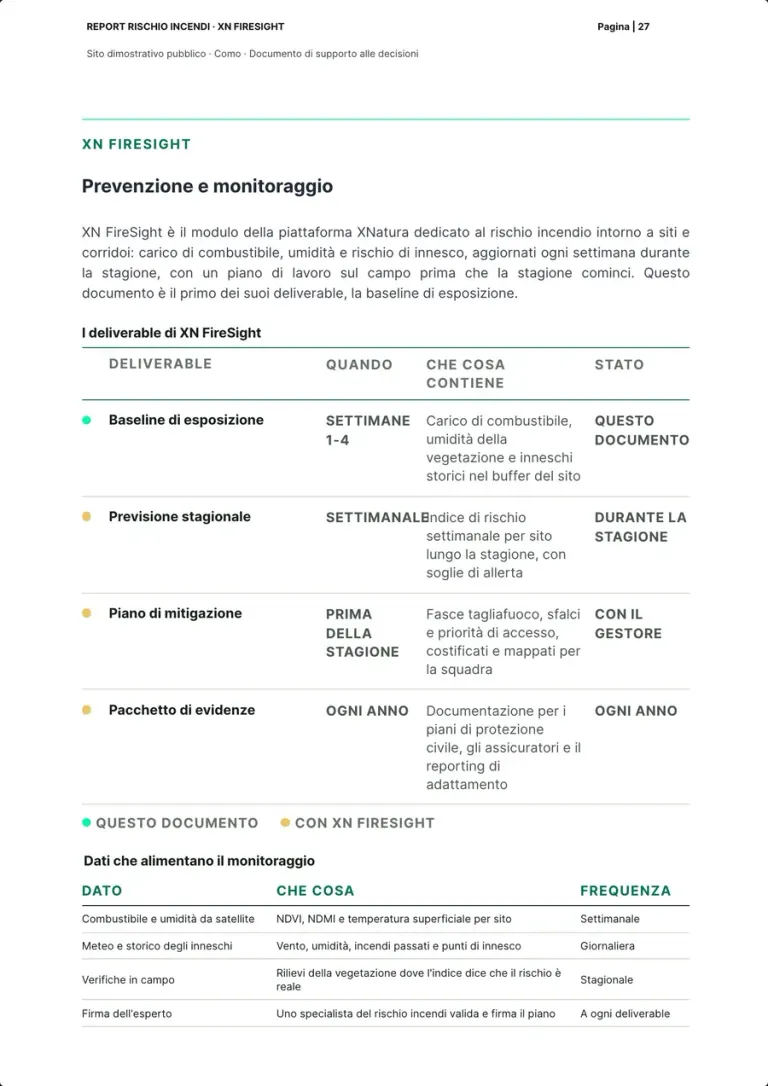
XN FireSight is the platform's module for wildfire risk around sites and corridors. This document is the first of its deliverables, the exposure baseline; the table lists the others with when they come and what they contain, then the data that feed the monitoring: fuel and moisture from satellite, weather and the ignition record, field checks.
Who does it Our team
Real page · public demo site in Como · p. 27/30 XN FireSight and monitoring27 / 29
Three fronts before the season, and what XN FireSight does not do
- Prepared by our team
- Left to the company or the authorities
What the rules and the sources ask
The municipality approves the register of burnt land, and Civil Protection issues the national bulletin on susceptibility to ignition (Law 353/2000, art. 10(2); Civil Protection, national bulletin).
How the report shows it
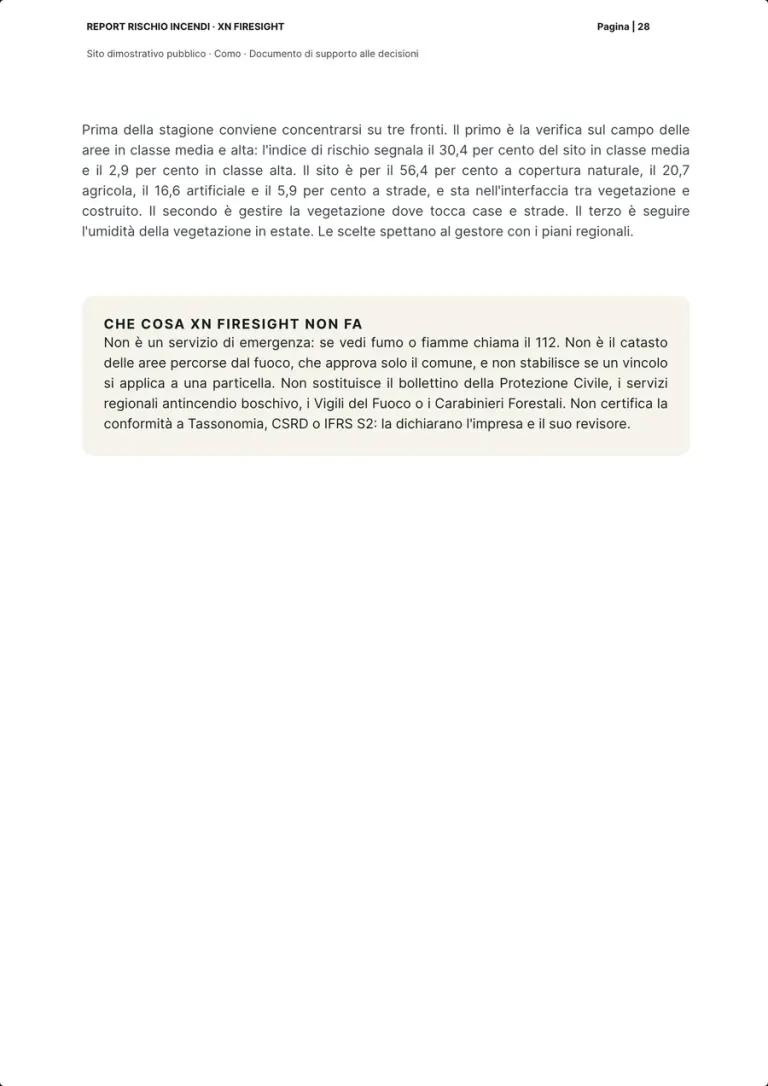
Three fronts: check on site the areas in the medium and high classes of the index, 30.4% and 2.9% of the site; manage vegetation where it touches houses and roads, on a site that is 56.4% natural, 20.7% agricultural, 16.6% artificial and 5.9% roads; follow vegetation moisture in summer. The choices are the site manager's, with the regional plans. The box: this is not an emergency service, and if there is smoke or flames you call 112.
Who does it Our team; the choices are the site manager's
Real page · public demo site in Como · p. 28/30 Method and sources28 / 29
Method, sources and limits
- Prepared by our team
What the rules and the sources ask
The FWI describes weather danger: neither a probability of fire nor a loss in euros can be read from the FWI alone (Copernicus, Fire Weather Index).
How the report shows it
Measured data: perimeter, land cover, 30 m map, VIIRS detections, NDVI, NDMI, surface temperature, climate series and aridity, from the platform; the class from method v1. The limits: half-degree ThinkHazard! cells on the 1981 to 2016 climate, an interface read on vegetation within 6 km and not on building density, a 30 m map without slope, aspect, roads or past fires, aridity on cells of about 1 km. No value is a probability of fire or a financial loss.
Who does it Our team
Real page · public demo site in Como · p. 29/30 Method and sources29 / 29
The sources
- Prepared by our team
What the rules and the sources ask
EFFIS content is published under CC BY 4.0, with credit required and changes indicated (EFFIS, data license).
How the report shows it
The list of sources: Law 353/2000 and Decree-Law 120/2021, the Civil Protection bulletin, EFFIS, Regulation 2021/2139 with 2026/73, Directive 2026/470 and the ESRS of Regulation 2026/1563, IFRS S2 of June 2023, COM(2026) 330, ThinkHazard! (Leonard et al. 2017), Schug et al. 2023, ESA WorldCover 2021, the Global Aridity Index, the CMIP6 projections, Van Wagner 1987, VIIRS, Sentinel-2, Landsat 8 and 9.
Who does it Our team
Real page · public demo site in Como · p. 30/30
How the 30 m map is made
Four factors per pixel. How prone the land is, not a fire.
For each 30 m pixel the platform combines land cover, summer vegetation vigour, aridity and summer land surface temperature, with weights drawn from the literature. The result is a score from 0 to 1: it shows where the land is most prone to burn.
Satellites and datasets
Open imagery and maps, each with its date.
Four factors
Fuel 0.35, summer vigour 0.25, aridity 0.20, land surface temperature 0.20.
0.32 mean index of the site
Summer 2025, on a scale from 0 to 1; maximum 0.73.
The field
The areas in the medium and high classes are the first to check on site.
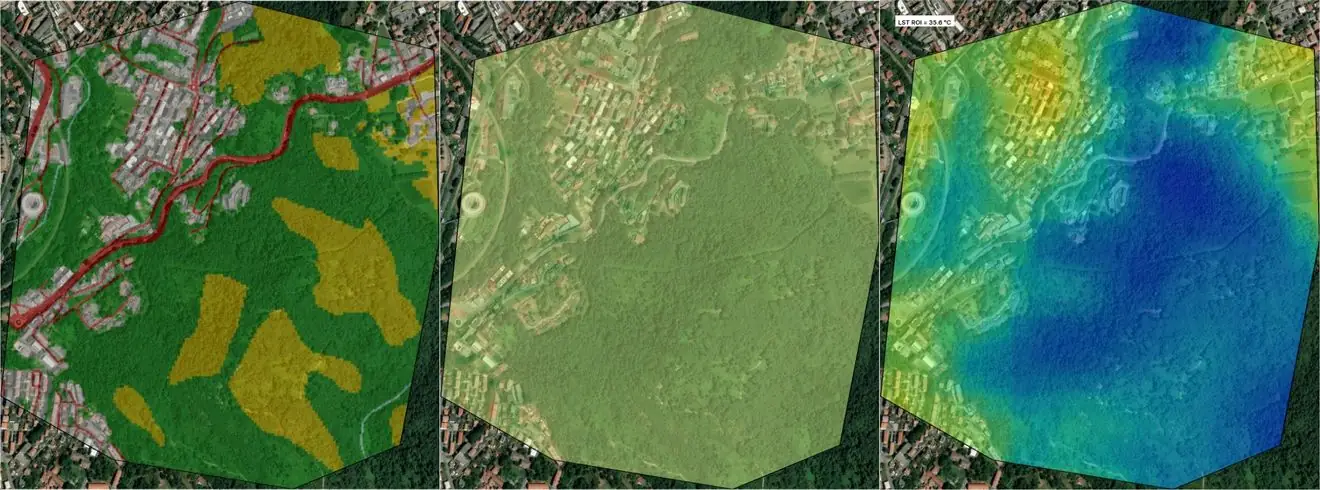
Same area, three layers
Switch the layer, the perimeter stays put.
The three maps come from the report, pages 5, 14 and 22, cropped to the same scale: land cover, the 30 m risk index of summer 2025 and the land surface temperature of August 2026.

Land Use 
Natural Habitat Coverage 
Built-Up Surface 
Aridity 
Land Surface Temperature 
Heat Islands 
Extreme Events 
Water Coverage
Indicator cards of the XNatura platform, from the site's Satellite maps page. The platform's satellite maps
In the field with Biodiversa
The satellite says where to look. The field checks.
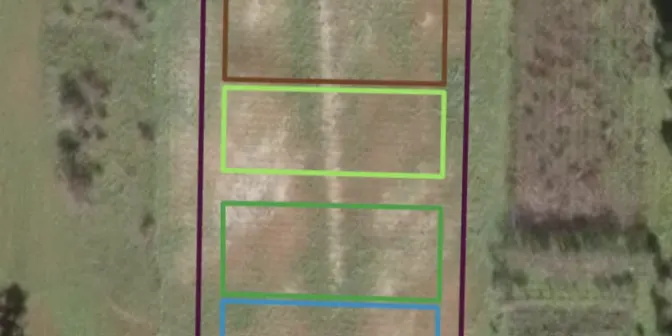
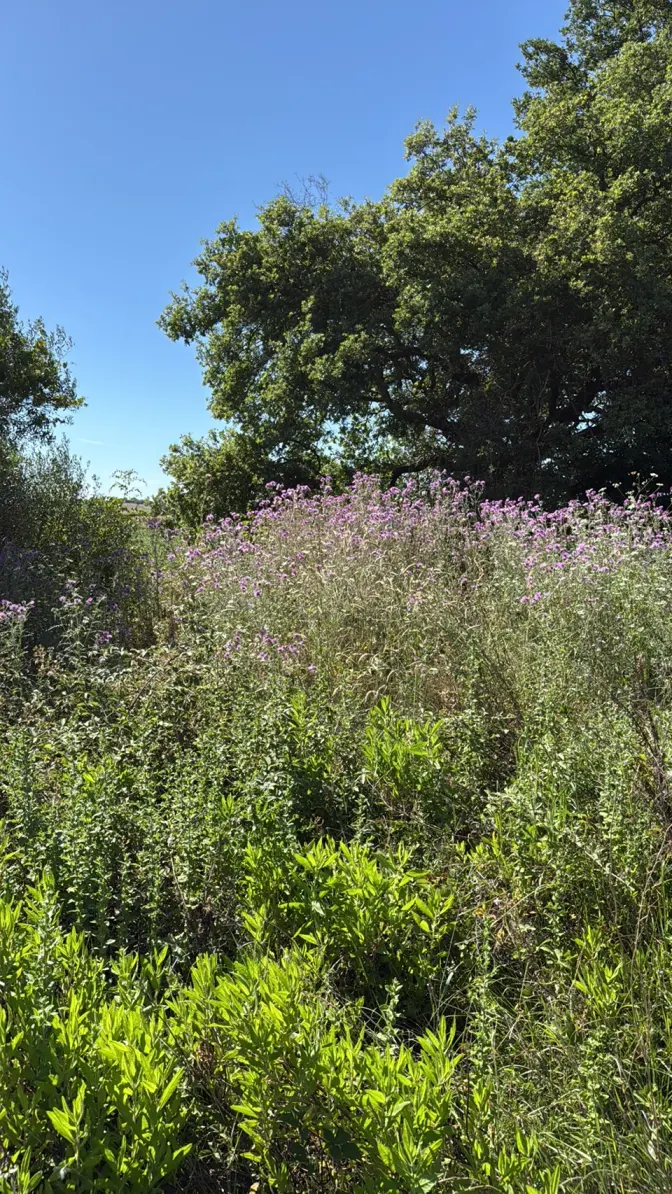
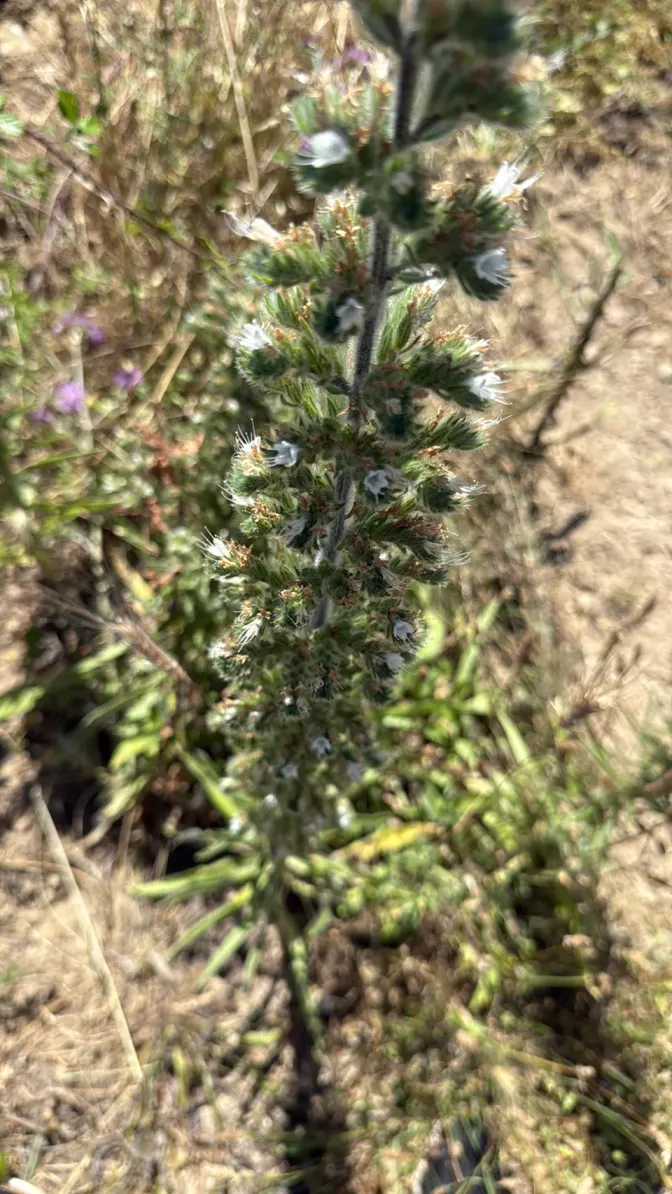
The report says where to start before the season: the areas in the medium and high classes of the 30 m index. On site every record is made with the Biodiversa app, with its photo and position, straight into the platform.
- FieldSurvey with the app
- CheckValidated by the expert
- DataCensus observations
- ReportThe record shows up in the report
The Nature Experts
We prepare the report. The decisions stay with whoever runs the site.
Our Nature Experts prepare the report with the platform's data and read it with published methods, every rule with its source. The document is decision support for the company: it does not replace the authorities and does not decide constraints.
- 01MeasurePerimeter, land cover, 30 m index, detections, moisture, temperature, climate
- 02ExplainThe Italian and EU rules, each with its source
- 03FollowThe same indicators repeated over time, with XN FireSight
- 40+in-house nature, climate and ESG specialists
- 7disciplines under one roof
- 10years of track record
Who works on a wildfire risk
Our team
Prepares the report on the platform's data and explains its method and limits. It is not the register of burnt land and not an emergency service.
The company
Decides the actions on site and declares compliance with the Taxonomy, the ESRS or IFRS S2 with its auditor.
The municipality
Keeps and approves the register of burnt land, from which the constraints arise.
The region
Approves the wildfire plan, reviewed every year, with the risk areas and periods.
Civil Protection and rescue
The daily Civil Protection bulletin, the regional wildfire services, the fire brigade (Vigili del Fuoco) and the forestry police (Carabinieri Forestali); in an emergency, 112.
The team's disciplines
 Ecology & biodiversityBiologists, faunal zoologists, environmental engineers: baselines, surveys, camera traps, bioacoustics, telemetry.
 Assessment, reporting & complianceESRS E4, BNG, SBTN, GRI, EIA/SEA, VIncA, BREEAM/LEED. Board- and authority-ready.
 Agronomy & land useRegenerative agriculture, supply chains, land and vegetation management.
 Data & remote sensingGIS, satellite analysis, IoT data, predictive models, digital twinning.
 Climate & riskIPCC scenarios, physical risk, wildfire and water modelling per asset.
 Strategy & deliveryNature strategy, action plans, green finance, stakeholder engagement, client training.

What the report does, and what it does not
An input to the company's decisions. The rest belongs to others.
The report prepares the hazard screening, the methodology and the evidence, with their sources. The company and its auditor declare compliance, constraints come from the municipal register, and emergencies are for 112.
| Reference | What the report supports | Left to the company |
|---|---|---|
| EU Taxonomy, Appendix A | Wildfire hazard screening and data to assess its materiality | Full assessment, adaptation solutions, plan |
| Revised ESRS E1-2 | Documented methodology of the site's exposure to the hazard | Classification of material risks, financial effects (E1-11) |
| IFRS S2, paragraphs 22 and 29(c) | Hazard and exposure evidence for scenario analysis | Resilience analysis, amounts and percentages |
| Law 353/2000 | Context and a pointer to check the municipal register | Checking the register and the duties of the regional plan |
Report, p. 11. The revised ESRS enter into force on 10 November 2026 and apply to financial years beginning on or after 1 January 2027.
Who steps in where the report stops
Emergency
If you see smoke or flames, call 112: the report is not an alert service.
Report, pp. 17 and 28
Register and constraints
The municipality approves the register of burnt land; the report does not say whether a constraint applies to a parcel.
Law 353/2000, art. 10(2)
Bulletin and services
The report does not replace the Civil Protection bulletin, the regional wildfire services, the fire brigade or the forestry police.
Civil Protection, national bulletin
Compliance
The report does not attest compliance with the Taxonomy, the ESRS, the CSRD or IFRS S2: the company and its auditor declare it.
Report, p. 11
The voice that guides you through the report
Ask, and the page takes you there.
A voice assistant always within reach, bottom right. Ask it about a section of the report, the site's class or who does what: it answers and brings the page to the right point.
- It answers about this page: the wildfire risk of the Como site, the rules, what each section of the report shows.
- It walks you through the document: it scrolls to the section and highlights it while you keep talking.
- If you want a first analysis of your site on the platform, it prepares it, and you open it on XNatura after signing in.
You can ask, for example
- Take me to the 30 m map
- Why is the site's class C?
- What does Italian law ban on burnt land?
- Does the report replace the register of burnt land?
- I'd like a first analysis of my site on the platform
Contact
A site or a portfolio to assess for wildfire risk?
Tell us about the sites, the sector and your timing. A named strategist replies within 24 working hours.
30 minutes with the XNatura team
Video call on Google Meet
Would you rather talk it through?
Either way you are speaking with an AI assistant, and the conversation is transcribed. How we handle your data
Tell us about your sites
Request sent.
One of our strategists replies within 24 working hours. If you need us sooner, write to info@3bee.com.
Our systems are temporarily unreachable and the request did not go through. Try again, or write to info@3bee.com.
FAQ
Frequently asked questions on wildfire risk
What is a site's wildfire risk?
It depends on two things: how often the weather makes vegetation ready to burn, measured with the Fire Weather Index, and how much burnable vegetation surrounds the site. The report measures both with the XNatura platform's data: for the demo site in Como the class is C, medium, with the platform's method v1.
Is the FWI the probability that the site burns?
No. The Fire Weather Index is a weather-danger index: it combines temperature, humidity, wind and rain and says how far the weather favours ignition. It is not the probability of a fire at a site and it is not a financial loss.
Does the report replace the register of burnt land?
No. In Italy the register (catasto) is kept and approved by the municipalities, which update it every year (Law 353/2000, art. 10(2)): constraints arise from it, not from a satellite map. The report does not say whether a constraint applies to a parcel and points to the municipal register.
Does it help with the Taxonomy, the ESRS or IFRS S2?
It supports the screening and materiality assessment of the wildfire hazard the Taxonomy asks for (Delegated Regulation 2021/2139, Appendix A), the exposure methodology of the revised ESRS E1-2 and the evidence for IFRS S2 scenario analysis. The company and its auditor declare compliance: the report does not attest it.
Do satellite detections flag fires in progress?
No. VIIRS thermal detections arrive within 2 or 3 hours, have 375 m pixels, can miss small fires or fires under smoke and cloud, and not every thermal anomaly is a fire. The report tells the site's record; if you see smoke or flames, call 112.
Do climate projections change the site's class?
No. The method v1 class describes the climate from 1981 to 2016 and stays C in every scenario. The projections are indicators of direction: under SSP5-8.5 the days a year with FWI of 20 or more go from 14.8 in 2026-2040 to 65.7 in 2075-2100. The 12, 20 and 30 thresholds are the Canadian ones of the risk module, not the EFFIS classes.
Is the report's site a client?
No. It is a public demo site on the edge of Como, 132.49 hectares, already public on the wildfire risk map of ilovenatura.com: no client, no owner, no assignment. The report is real, generated with the XNatura platform on 9 October 2026.
XNatura · AI
Voice assistant
Ask me about a section of the report, the site's class or who does what: I'll take you where you need to be.
You can ask, for example
- Take me to the 30 m map
- Why is the site's class C?
- What does Italian law ban on burnt land?
- Does the report replace the register of burnt land?
- I'd like a first analysis of my site on the platform
You’ll speak with XNatura’s AI assistant. Your microphone only starts with your permission. You can review and confirm your details before sending a request. If the assistant prepares a demo for you, the site’s name and location go to the XNatura platform, which keeps them for one hour so you can open it. How we use your data
Getting your conversation ready…
The conversation
Start with a question or tell us what you need.
Your project updates as you speak
Review and send your request