





Biodiversity Credits · UNI/PdR 179:2025
A biodiversity credit, from baseline to certificate.
The Italian reference practice UNI/PdR 179:2025 measures nature's improvement in MSA: one credit is worth 0.1 hectares of full regeneration for one year. Here you see how a project is built, page by page, from baseline to monitoring.
We led the table that wrote the practice, with the University of Naples Federico II, the University of Turin, CREA and Climate Standard. Credits are certified by an independent validation and verification body, not by us.
The XNatura AI assistant answers straight away and books the call for you.
The life of a credit
15 to 30 years, with a verification after the first year and then every three.
Initial report
MSA baseline with historical, biogeographical and Natura 2000 data; a Biodiversity Plan with measurable targets and monitoring methods; evidence of additionality.
Section 6.4
Ex-ante validation
The validation and verification body approves the project. A project already under way can be validated up to 3 years after it started.
Sections 6.1 and 6.3
Implementation
Converting man-made areas into meadow, woodland or wetland, or minimisation: less mowing, non-intensive or regenerative farming.
Section 6.5
One year of monitoring
Birds and arthropods as the suggested taxa, with the bioacoustic sensors and camera traps the practice recommends, and ISPRA protocols.
Section 6.3, Annex E
Ex-post verification and certificate
The body checks the project follows the plan and issues the certificate for that year's credits. Each project has an identifier, each credit a code.
Sections 6.3 and 6.6
Three-yearly verifications
Checks on real data every three years for the whole duration. Buyers use the credits for 5 years in their own Biodiversity Plan.
Sections 6.3 and 6.6
The report, page by page
From the project sheet to the public claims.
The pages are real: they come from an initial report generated with the platform from the template for the initial report of UNI/PdR 179:2025. The project is simulated, on a real study site at Porto Mantovano (MN), next to the Natura 2000 site Bosco Fontana: the baseline is measured by the platform, the actions and the credits are a project assumption. No client, no person, no credit validated or issued. The pages stay in Italian, the language of the report. For each section: what the practice asks for, how the report shows it and who does it.
Initial report of a Biodiversity Credits project under UNI/PdR 179:2025, generated with the platform, study site at Porto Mantovano (MN), in Italian · 26 numbered pages plus the cover, PDF not public
Where each section comes from
- Measured by the platform
- By the expert, on the project scenario
9 sections out of 21 measured by the platform, 12 built by the expert on the project scenario. Validation and verification belong to the validation and verification body.
The project01 / 21
The project sheet
- By the expert, on the project scenario
- Measured by the platform
What the practice asks for
The initial report is the project's first activity (section 6.4); the duration runs from a minimum of 15 to a maximum of 30 years (sections 6.2 and 6.3).
How the report shows it
One table says it all: 6.28 hectares at Porto Mantovano, 30 years as a project assumption, conversion into meadow, woodland and wetland, 47.2 credits expected a year. A box states that the project is simulated and that no credit has been validated or issued.
Who does it Team expert, on the platform's data
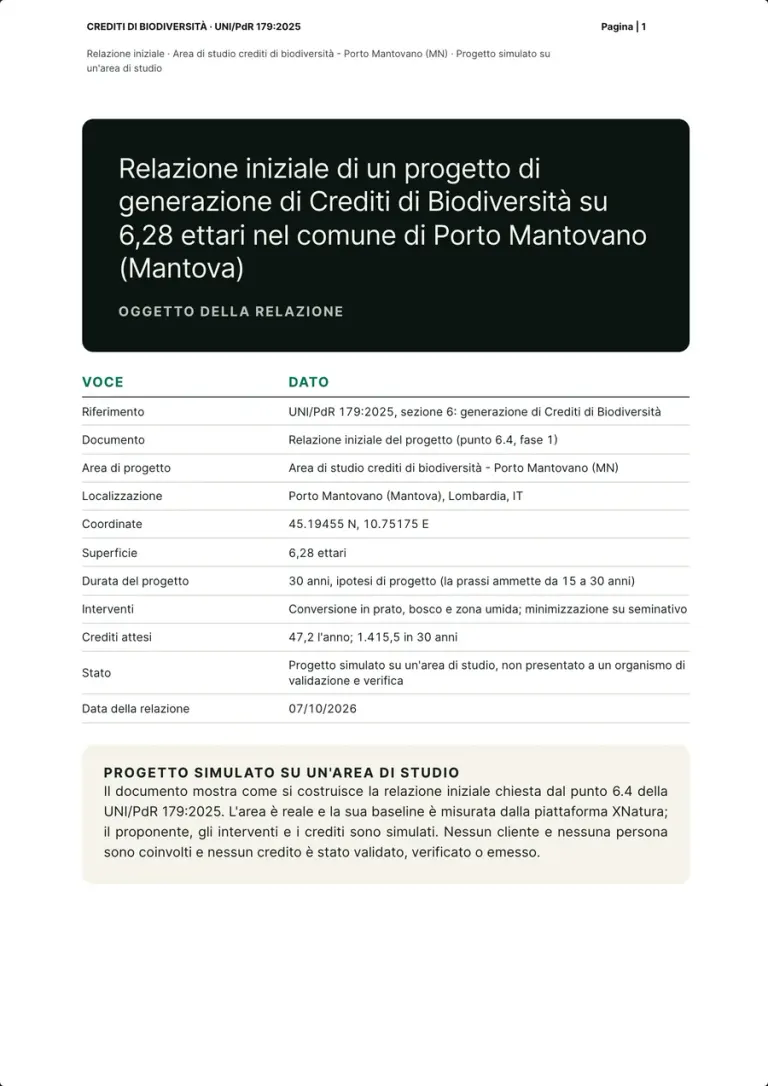
Real page · simulated project on a study site · p. 1/26 The project02 / 21
The summary and the project's figures
- By the expert, on the project scenario
- Measured by the platform
What the practice asks for
The process: ex-ante validation of the project, ex-post verification after one year of monitoring, then three-yearly verifications, with a yearly certificate of the credits generated (sections 6.1, 6.3 and 6.6).
How the report shows it
On one page: the perimeter's MSA goes from 0.106 to 0.857 in the project scenario, for 47.2 expected credits a year and 1,415.5 over 30 years, the equivalent of 4.72 hectares of full regeneration every year. Below, the five phases of the project, each with its section of the practice.
Who does it Team expert, on the platform's data
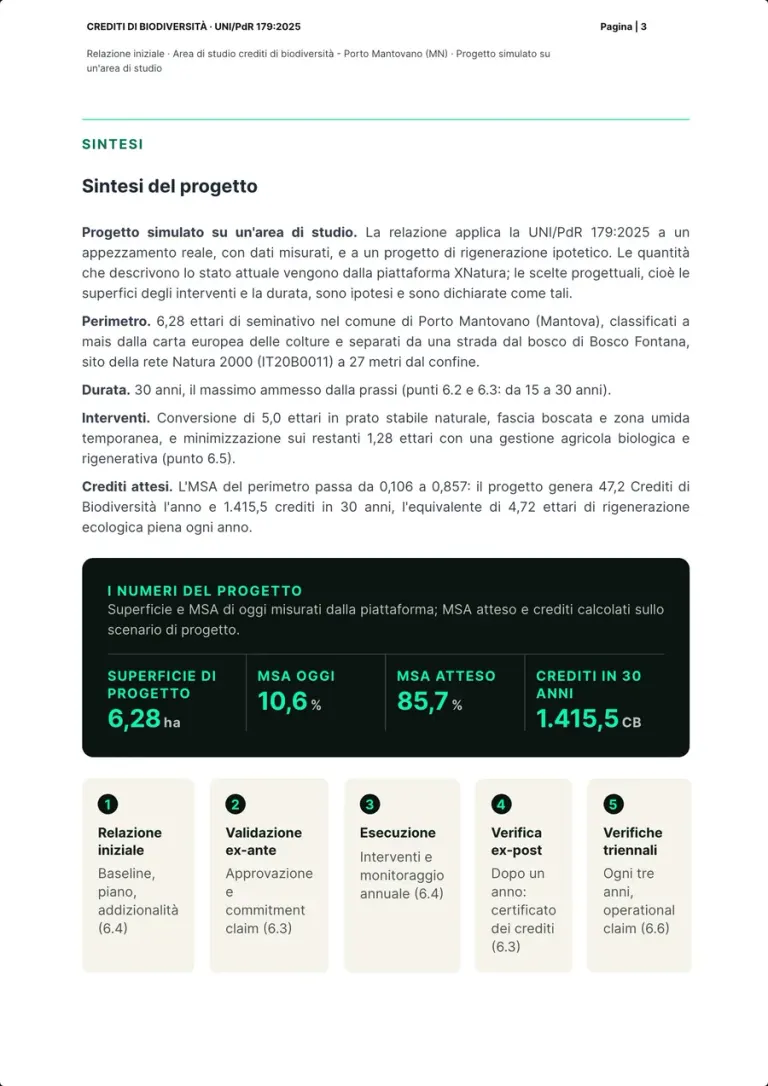
Real page · simulated project on a study site · p. 3/26 The baseline03 / 21
Perimeter and control area
- Measured by the platform
What the practice asks for
An MSA baseline that takes into account historical, biogeographical and Natura 2000 data (section 6.4).
How the report shows it
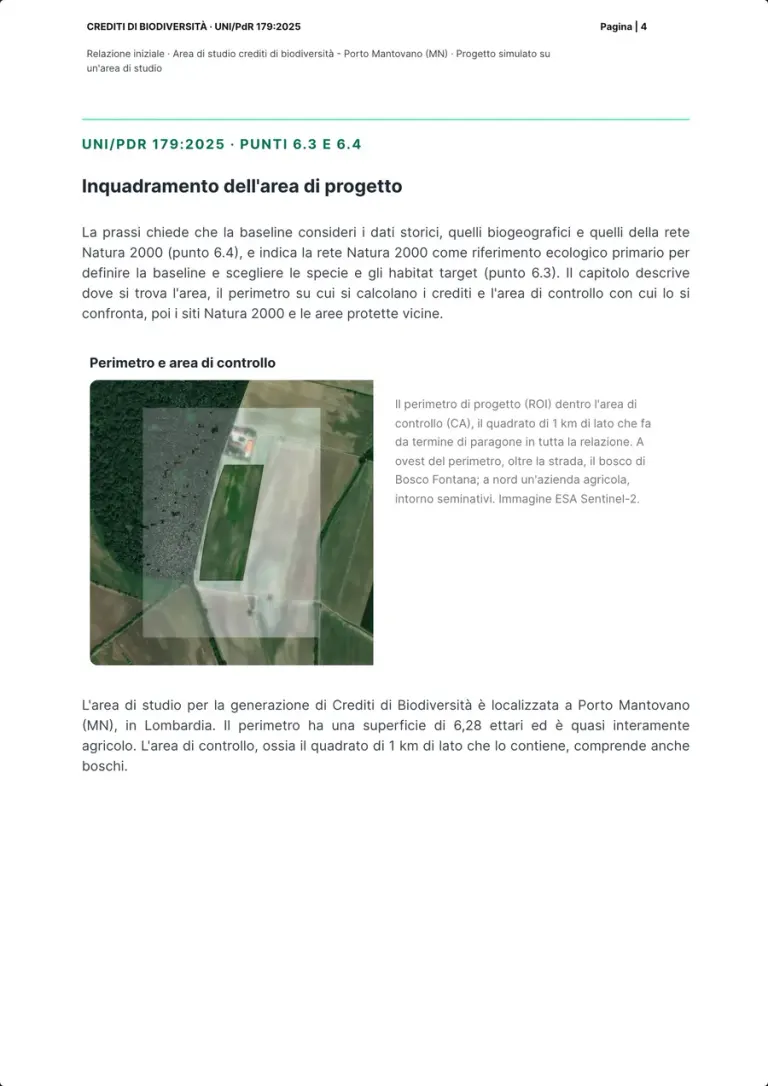
The platform draws the 6.28 hectare perimeter inside the control area, a square with 1 km sides used as the benchmark throughout the report, on a Sentinel-2 image: to the west, across the road, the Bosco Fontana woodland.
Who does it XNatura platform
Real page · simulated project on a study site · p. 4/26 The baseline04 / 21
Natura 2000 sites and protected areas nearby
- Measured by the platform
What the practice asks for
Natura 2000 data go into the baseline, with historical and biogeographical data (section 6.4).
How the report shows it
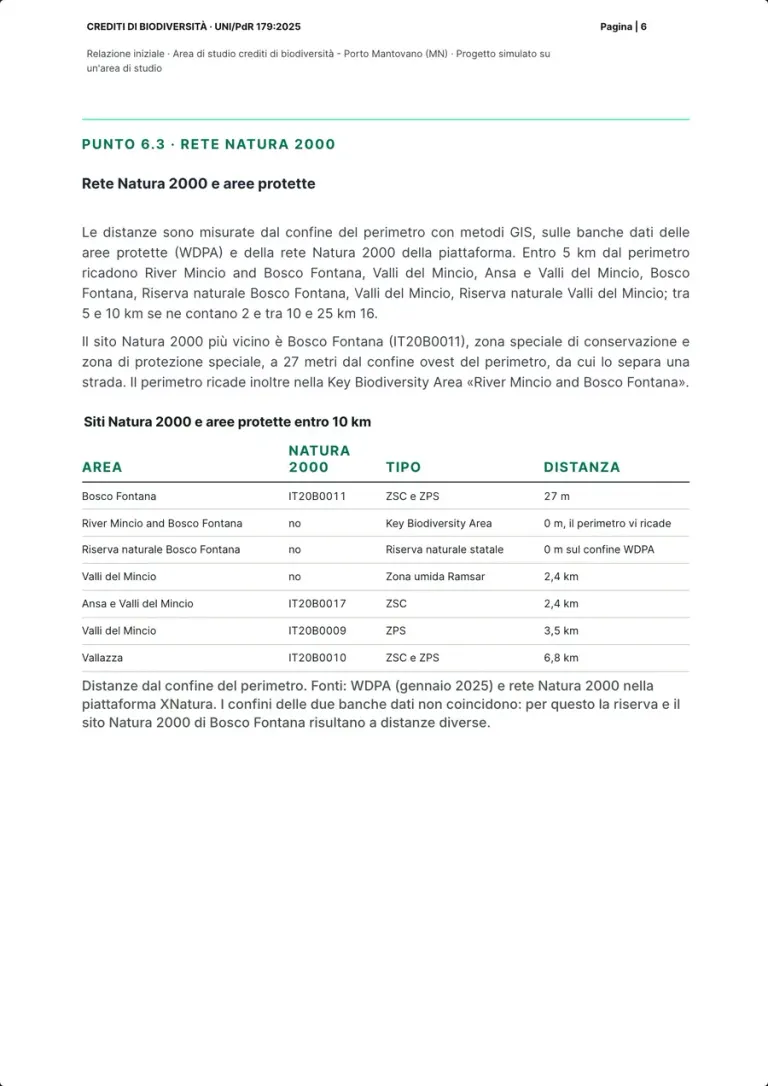
Distances are measured from the boundary with GIS methods: the Natura 2000 site Bosco Fontana (IT20B0011) is 27 metres away, the perimeter lies in the Key Biodiversity Area «River Mincio and Bosco Fontana», and the table lists seven areas within 10 km, up to Vallazza at 6.8 km.
Who does it XNatura platform
Real page · simulated project on a study site · p. 6/26 The baseline05 / 21
The maps of the protected sites
- Measured by the platform
What the practice asks for
Among its examples of action the practice names connectivity (section 6.5); the baseline uses Natura 2000 data (section 6.4).
How the report shows it
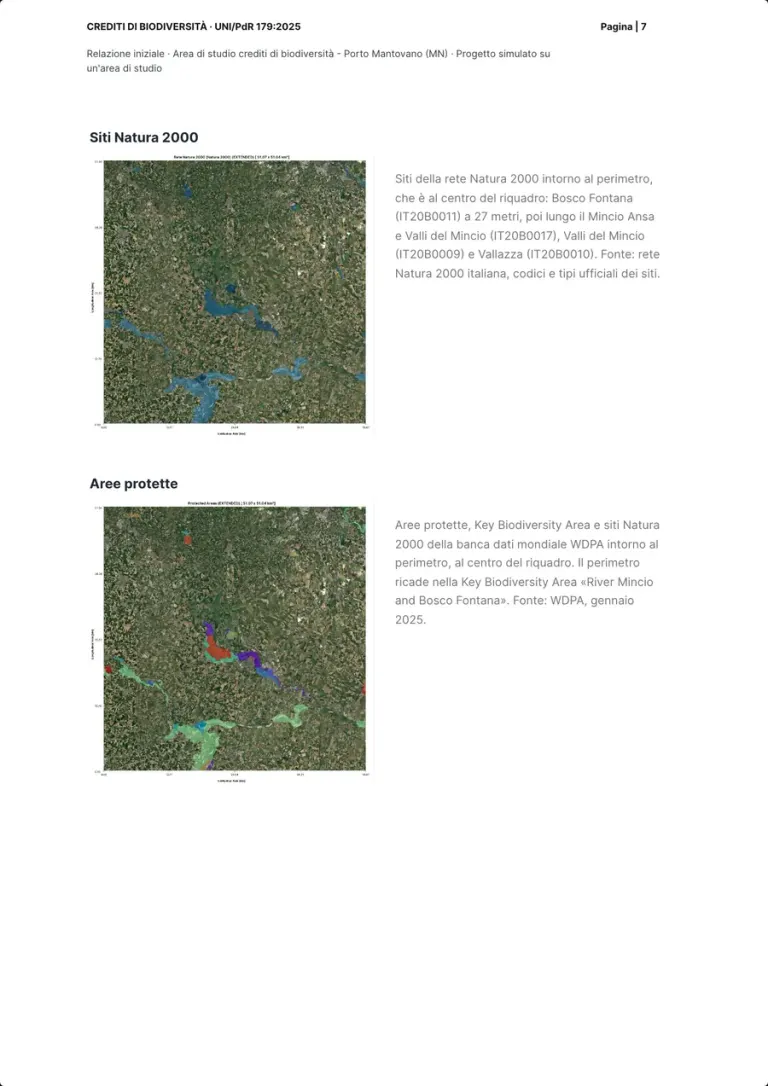
Two maps of the same frame, with the perimeter at the centre: the Natura 2000 sites along the Mincio, from Bosco Fontana (IT20B0011) to Vallazza (IT20B0010), and the protected areas of the WDPA database of January 2025, with the Key Biodiversity Area the perimeter lies in.
Who does it XNatura platform
Real page · simulated project on a study site · p. 7/26 The baseline06 / 21
The species of the Natura 2000 site
- Measured by the platform
- By the expert, on the project scenario
What the practice asks for
Among its examples of action the practice names actions for threatened species (section 6.5); the baseline uses Natura 2000 data (section 6.4).
How the report shows it
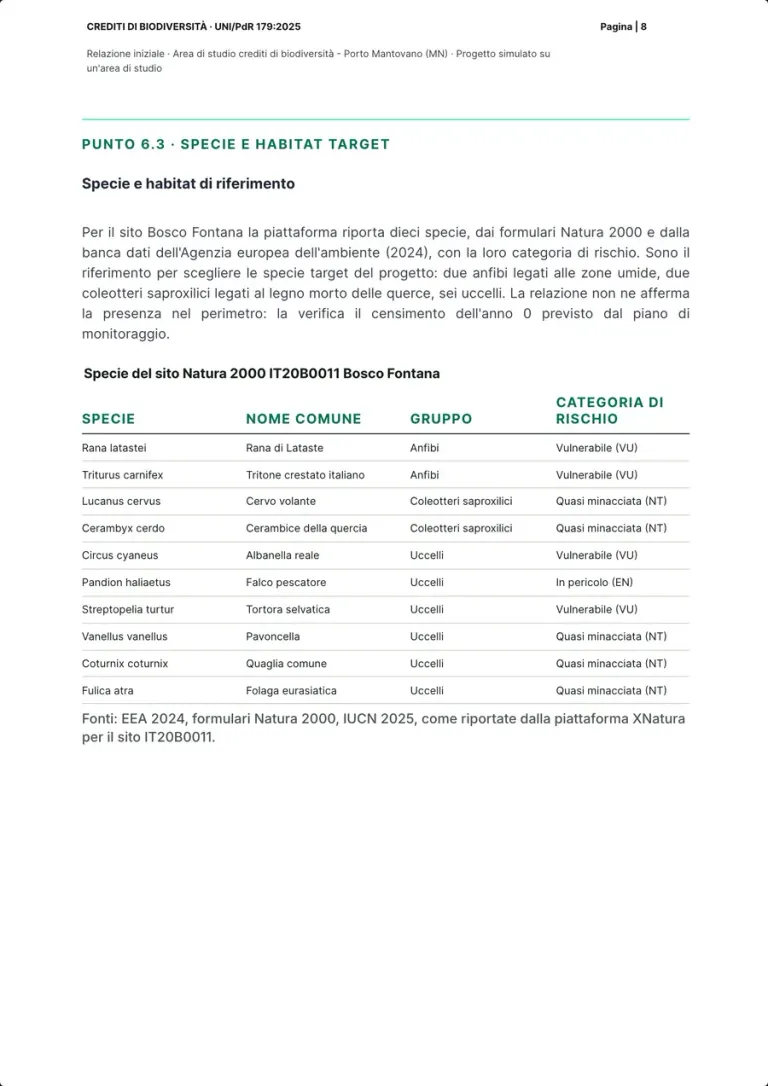
Ten species of the Bosco Fontana site, from the Natura 2000 standard data forms and the European Environment Agency (2024), with their risk category: two amphibians, two saproxylic beetles and six birds, from the endangered osprey to the vulnerable Italian agile frog. They are the reference for the target species; the year 0 census checks whether they occur in the perimeter.
Who does it XNatura platform, read by the expert
Real page · simulated project on a study site · p. 8/26 The baseline07 / 21
The EUNIS habitats
- Measured by the platform
What the practice asks for
Among the examples of action, habitat restoration (section 6.5); in the baseline, biogeographical data (section 6.4).
How the report shows it
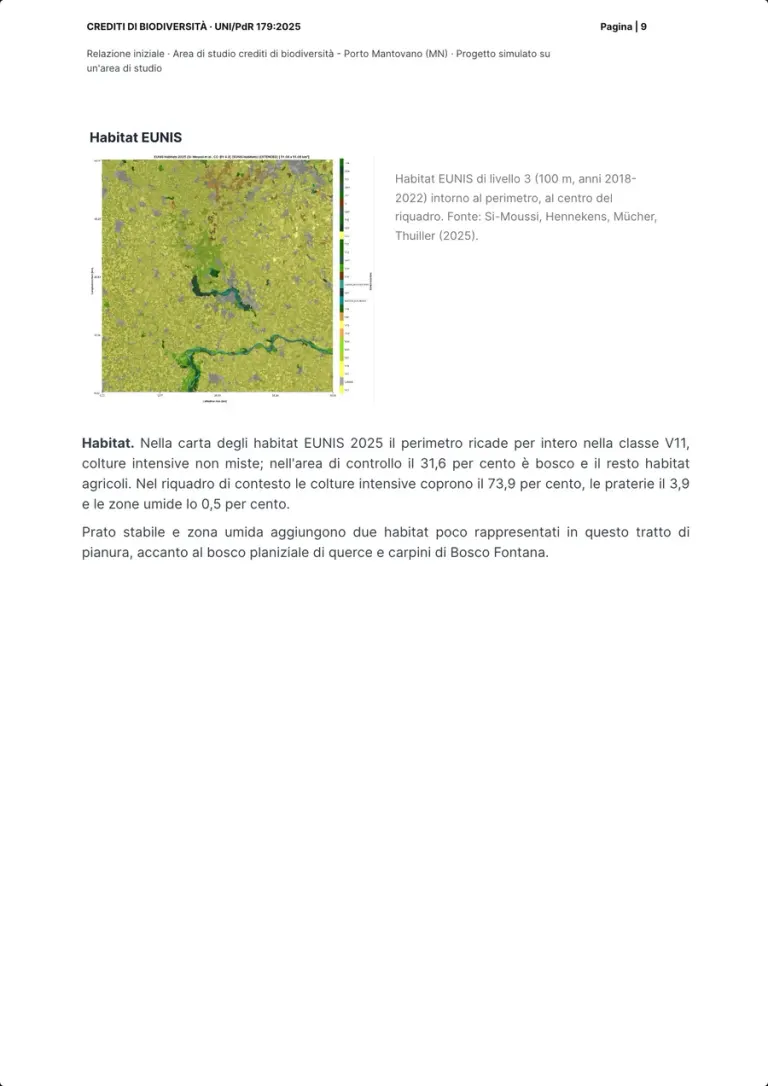
The level 3 EUNIS map, at 100 metres, puts the whole perimeter in intensive crops (V11); in the control area 31.6 per cent is woodland. In the wider frame grassland is 3.9 per cent and wetland 0.5: meadow and wetland add two habitats that are scarce here.
Who does it XNatura platform
Real page · simulated project on a study site · p. 9/26 The baseline08 / 21
Land use
- Measured by the platform
What the practice asks for
Land-use data with a resolution of at least 15 metres and at least 6 classes, for example Corine Land Cover, ESA WorldCover or Dynamic World (Annex C).
How the report shows it
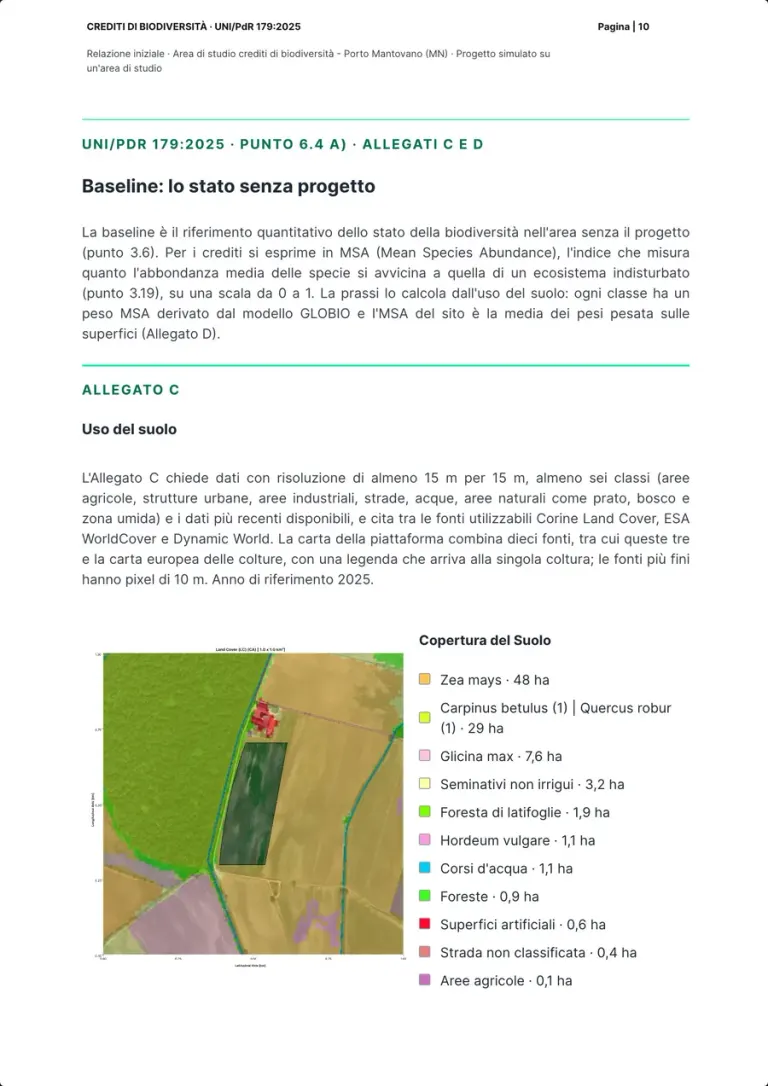
The platform's map combines ten sources, among them the three the practice names and the European crop map, with 10 metre pixels and a legend down to the single crop: in the control area 48 hectares of maize and 29 of hornbeam and oak woodland. Reference year 2025.
Who does it XNatura platform
Real page · simulated project on a study site · p. 10/26 The baseline09 / 21
From land use to MSA weights
- Measured by the platform
What the practice asks for
MSA by land use with the GLOBIO weights, plus 0.2 for regenerative practices (Annex D).
How the report shows it
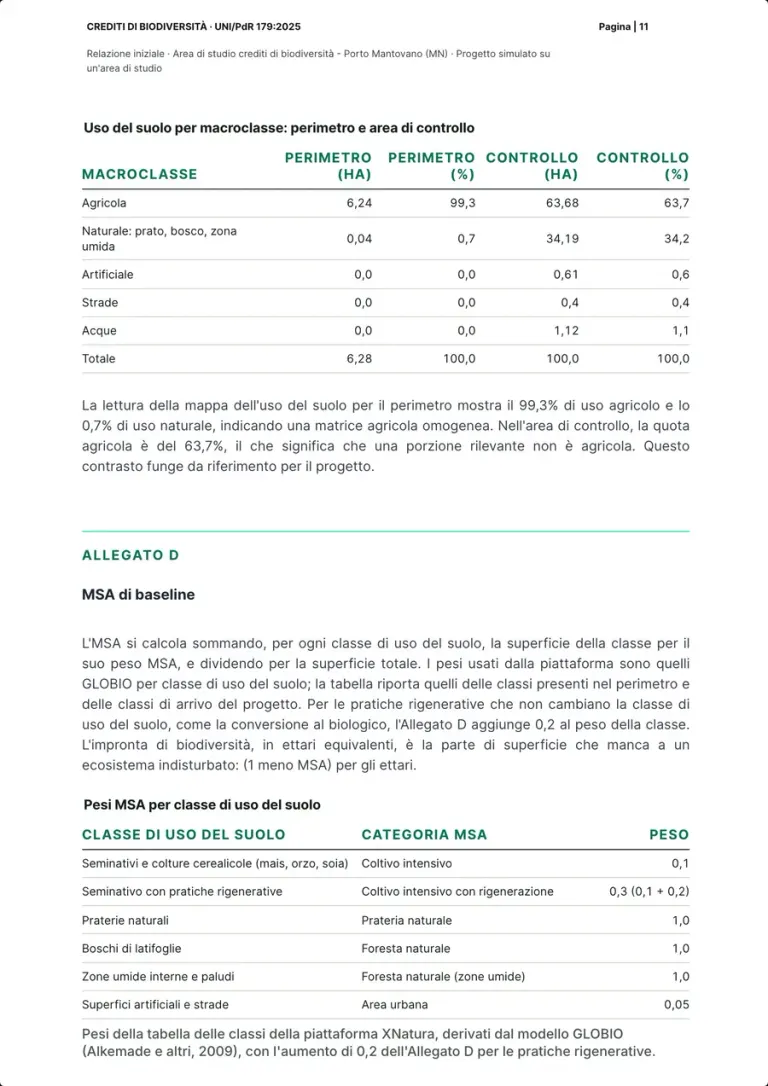
The perimeter is 99.3 per cent agricultural and 0.7 natural; the control area is 63.7 agricultural and 34.2 natural. The weights table: 0.1 for arable land, 0.3 for regenerative arable land (0.1 plus 0.2), 1.0 for meadow, woodland and wetland.
Who does it XNatura platform
Real page · simulated project on a study site · p. 11/26 The baseline10 / 21
The starting MSA
- Measured by the platform
What the practice asks for
The MSA baseline (section 6.4), calculated from land use with the GLOBIO weights (Annex D).
How the report shows it
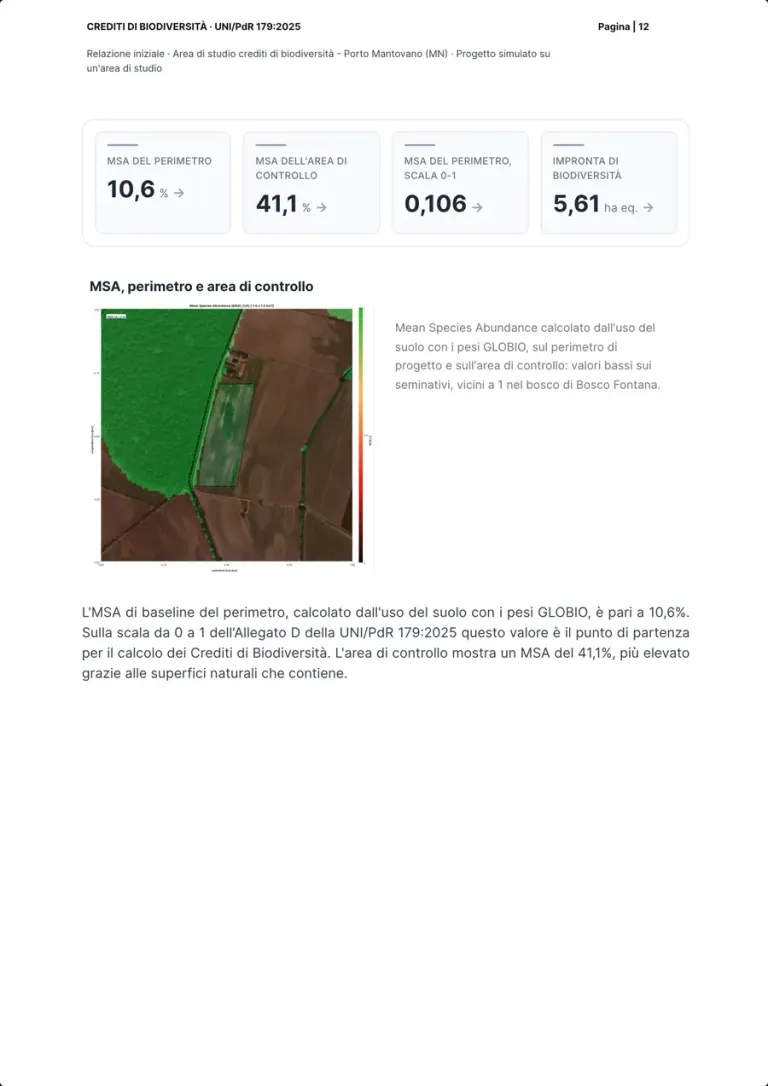
The perimeter's MSA is 10.6 per cent, that is 0.106 on the 0 to 1 scale, against 41.1 for the control area; the biodiversity footprint is 5.61 equivalent hectares. The map shows low values on arable land and values close to 1 in the woodland.
Who does it XNatura platform
Real page · simulated project on a study site · p. 12/26 The baseline11 / 21
Historical and biogeographical data
- Measured by the platform
What the practice asks for
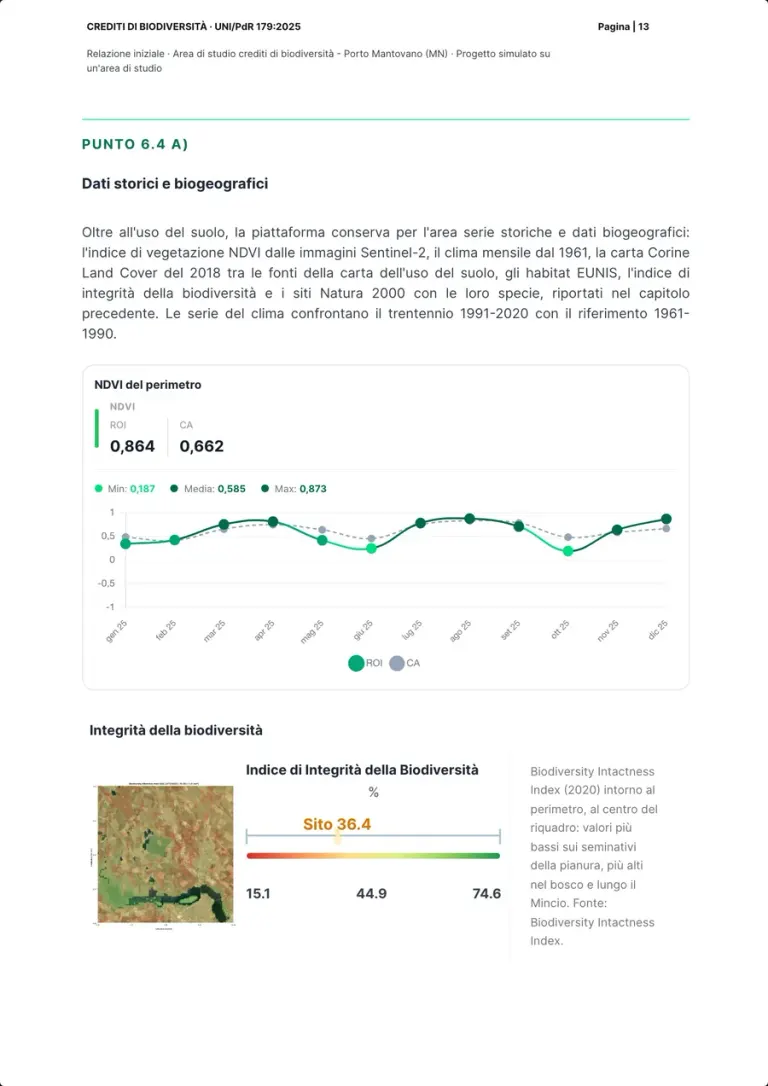
Historical and biogeographical data in the baseline (section 6.4).
How the report shows it
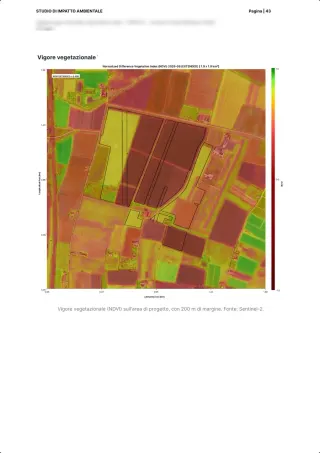
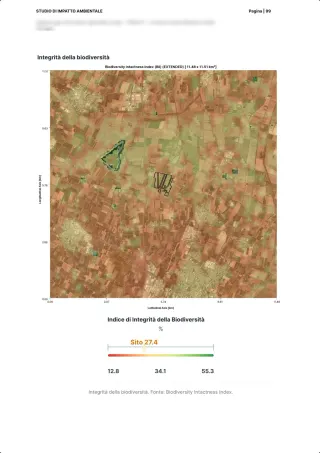
The monthly NDVI series from Sentinel-2, January to December, with 0.864 in the perimeter and 0.662 in the control area, and the 2020 Biodiversity Intactness Index, 36.4 for the site. The text also lists the monthly climate since 1961, comparing 1991-2020 with 1961-1990.
Who does it XNatura platform
Real page · simulated project on a study site · p. 13/26 The Biodiversity Plan12 / 21
The plan's actions
- By the expert, on the project scenario
What the practice asks for
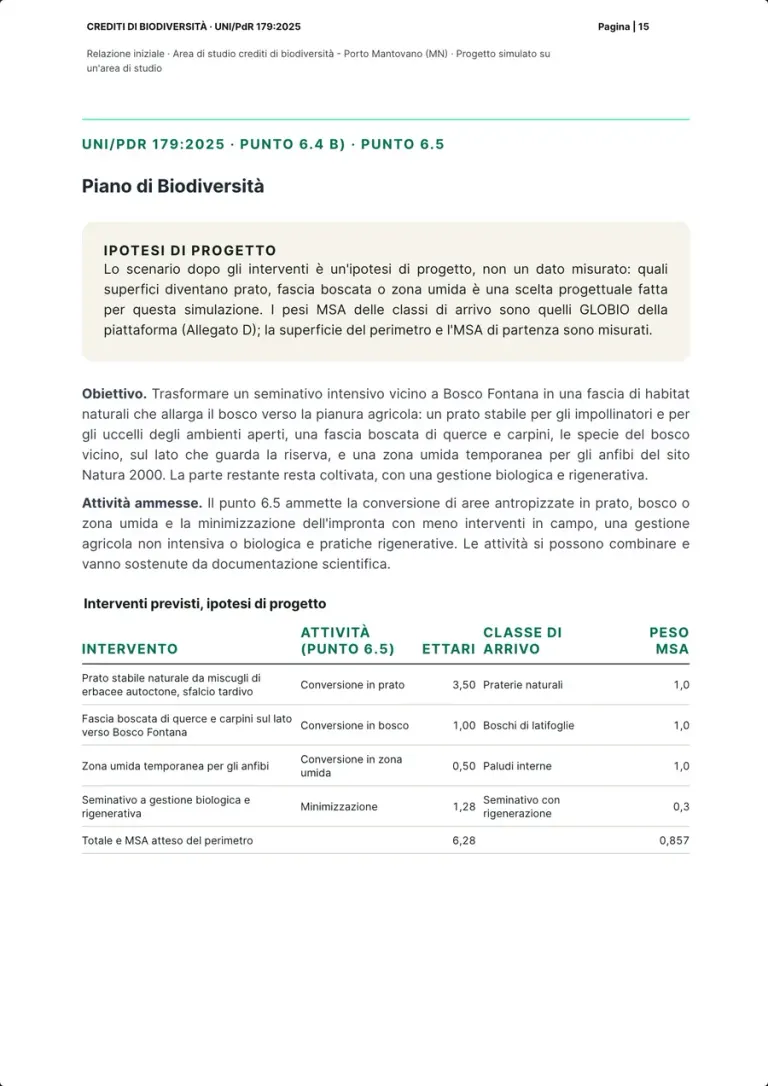
Admissible activities: converting man-made areas into meadow, woodland or wetland, and minimisation through less mowing, non-intensive or organic farming, regenerative agriculture (section 6.5).
How the report shows it
A box states that the scenario is a project assumption. The table assigns 3.50 hectares to permanent meadow, 1.00 to a woodland strip facing Bosco Fontana, 0.50 to a wetland for amphibians and 1.28 to regenerative arable land: the perimeter's expected MSA is 0.857.
Who does it Team expert, project assumption
Real page · simulated project on a study site · p. 15/26 The Biodiversity Plan13 / 21
MSA, footprint and targets
- By the expert, on the project scenario
- Measured by the platform
What the practice asks for
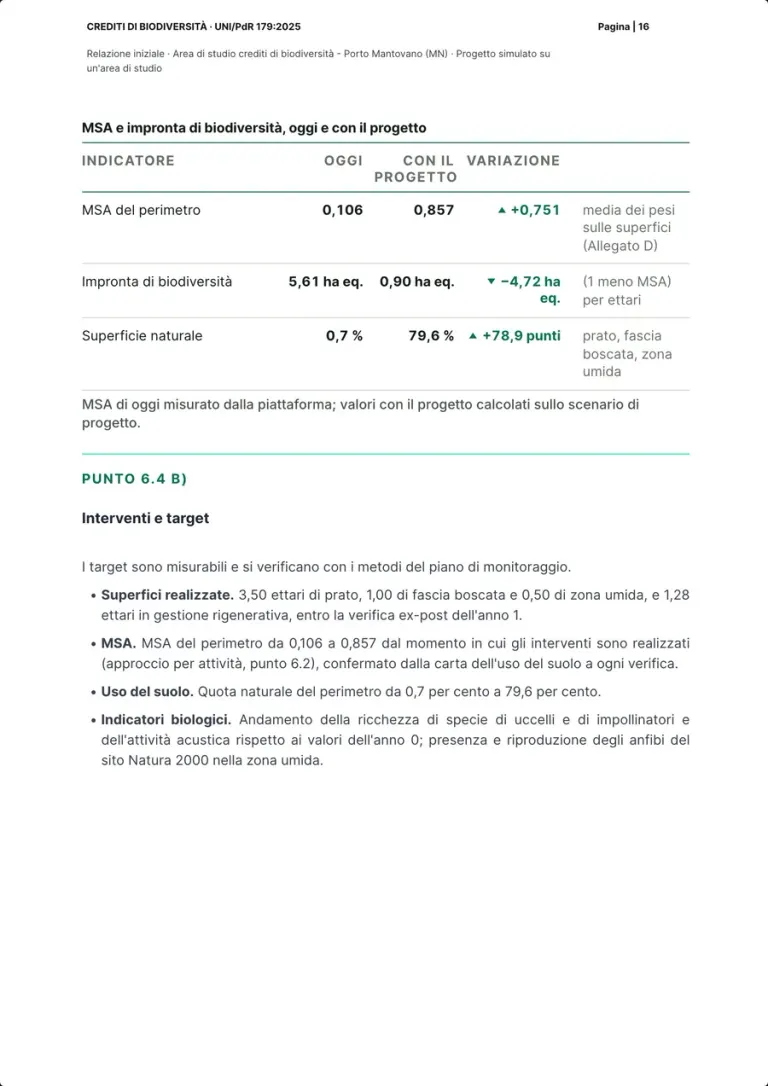
A Biodiversity Plan with measurable targets and monitoring methods (section 6.4); the value of an action is recognised from when it is carried out, on the expected MSA (section 6.2).
How the report shows it
Today and with the project: MSA from 0.106 to 0.857 (+0.751), biodiversity footprint from 5.61 to 0.90 equivalent hectares, natural surface from 0.7 to 79.6 per cent. The targets: the surfaces in place by the year 1 verification, the expected MSA from the time of the actions, the biological indicators against year 0.
Who does it Team expert, on the platform's data
Real page · simulated project on a study site · p. 16/26 The Biodiversity Plan14 / 21
Horizon, indicators and connectivity
- By the expert, on the project scenario
- Measured by the platform
What the practice asks for
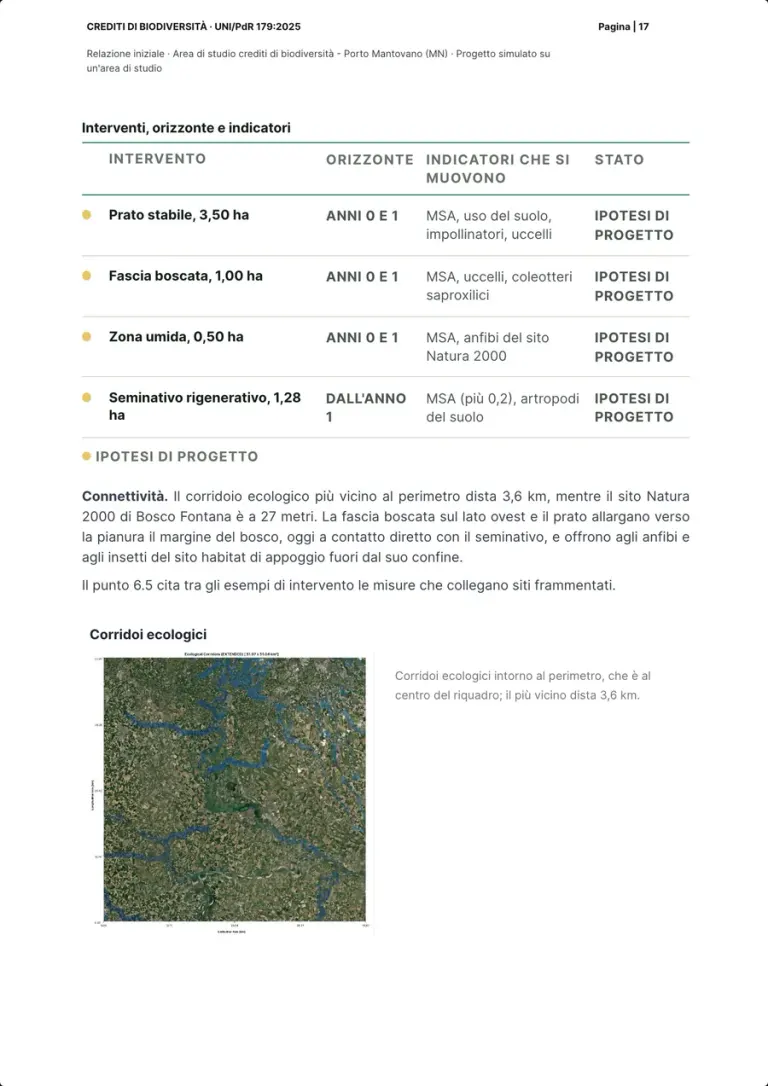
Among the examples of action: habitat restoration, threatened species, connectivity, control of invasive species (section 6.5).
How the report shows it
For each action, its horizon and the indicators it moves: the meadow for pollinators and birds, the woodland strip for saproxylic beetles, the wetland for the amphibians of the Natura 2000 site. The nearest ecological corridor is 3.6 km away, Bosco Fontana 27 metres: the woodland strip widens the edge of the wood.
Who does it Team expert, on the platform's data
Real page · simulated project on a study site · p. 17/26 The credits15 / 21
Additionality
- By the expert, on the project scenario
- From the proponent
What the practice asks for
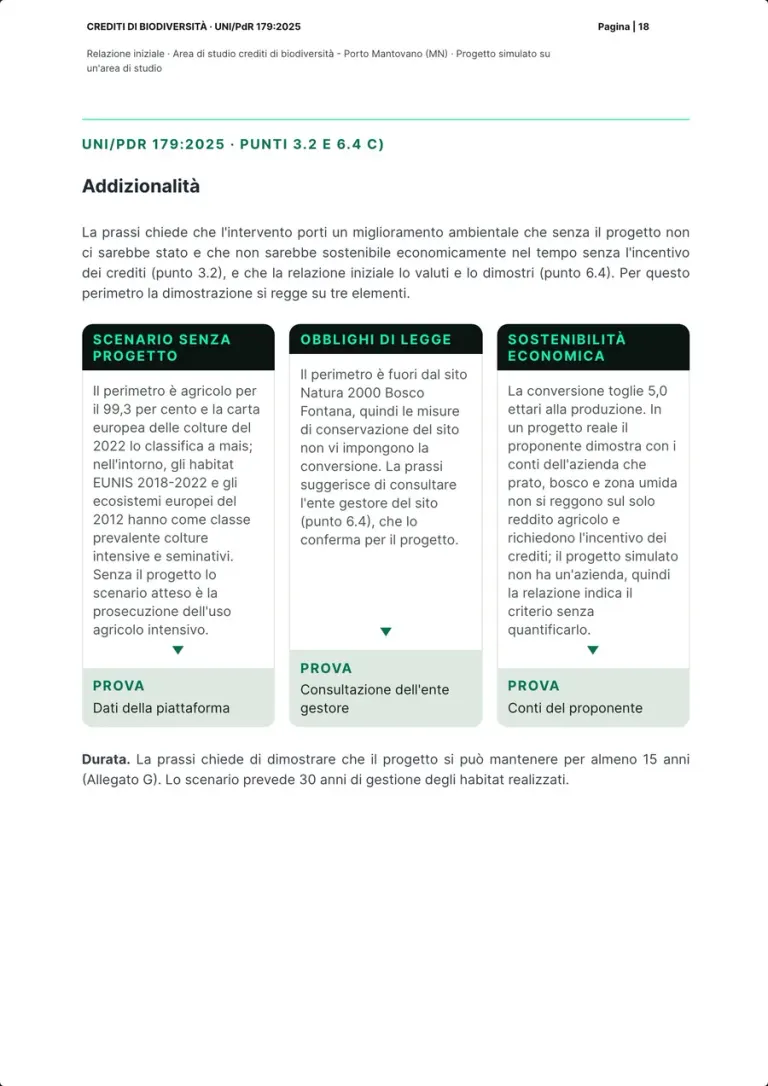
The credit is additional and durable (section 3.13), and the initial report demonstrates its additionality (section 6.4).
How the report shows it
Three proofs: the scenario without the project (the perimeter is 99.3 per cent agricultural, maize on the 2022 crop map), legal obligations (the perimeter is outside the Natura 2000 site) and economic sustainability, which in a real project the proponent proves with its own accounts. The scenario provides for 30 years of management.
Who does it Team expert; the accounts come from the proponent
Real page · simulated project on a study site · p. 18/26 The credits16 / 21
The credit calculation
- By the expert, on the project scenario
- Measured by the platform
What the practice asks for
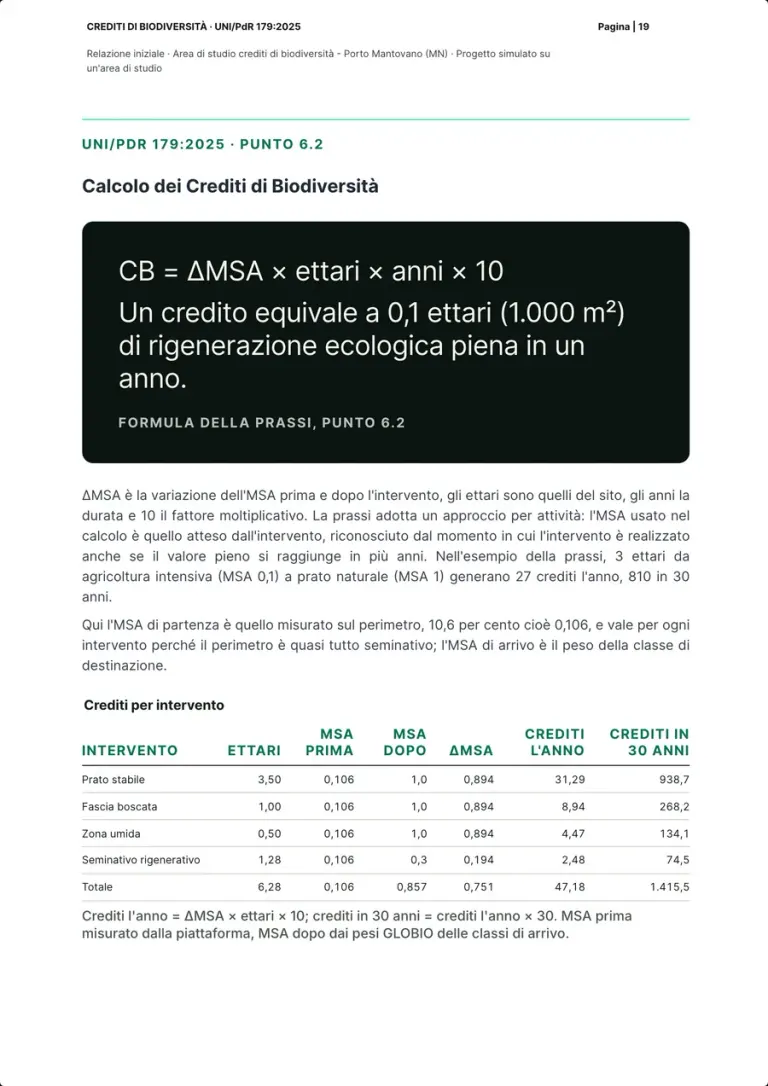
BC = ΔMSA × hectares × years × 10: one credit equals 0.1 hectares (1,000 m²) of full ecological regeneration for one year (section 6.2).
How the report shows it
The formula at the top of the page, the practice's example (27 credits a year on 3 hectares, 810 over 30 years) and the table action by action: from the measured MSA of 0.106, in the project scenario the meadow generates 31.29 credits a year, the total is 47.18 a year and 1,415.5 over 30 years.
Who does it Team expert, on the platform's data
Real page · simulated project on a study site · p. 19/26 The credits17 / 21
Expected credits, codes and registry
- By the expert, on the project scenario
What the practice asks for
Each project has a unique identifier and each credit a code; until a public registry exists the validation and verification body manages them, with no double counting. Retroactivity up to 3 years before validation; buyers use the credits for 5 years (section 6.3).
How the report shows it
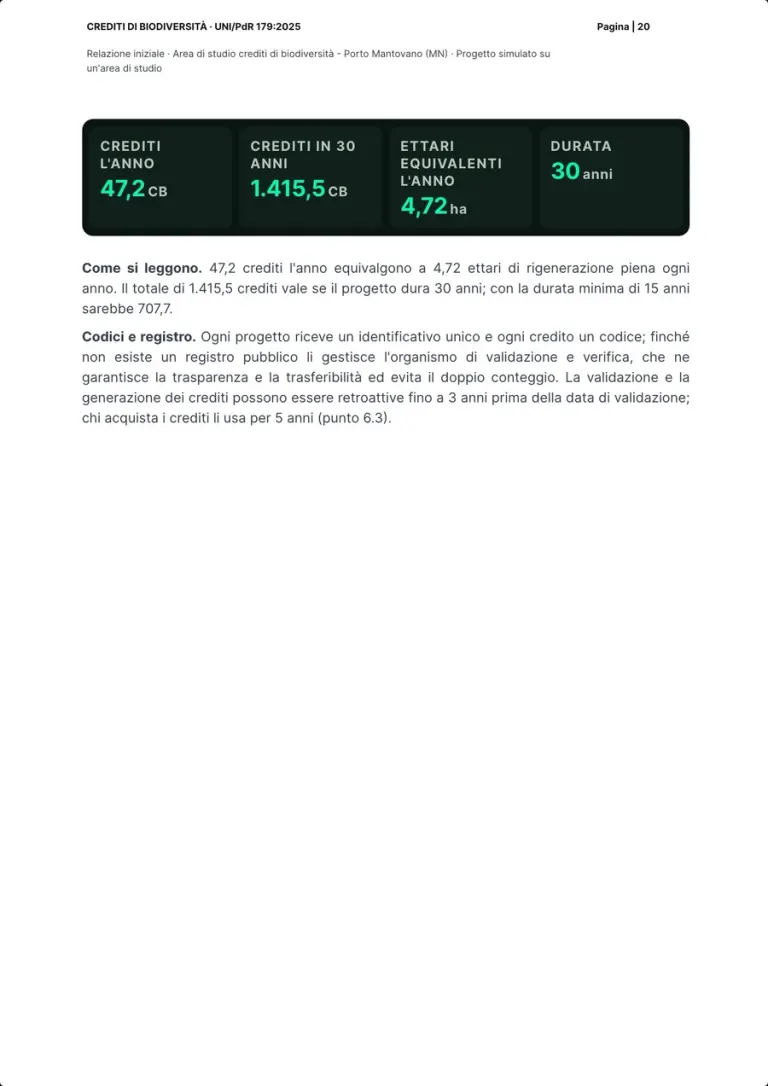
Four expected figures: 47.2 credits a year, 1,415.5 over 30 years, 4.72 equivalent hectares a year, a 30-year duration. With the minimum duration of 15 years the credits would be 707.7. The text explains identifiers, codes and registry as the practice requires them.
Who does it Team expert; codes and registry belong to the body
Real page · simulated project on a study site · p. 20/26 Monitoring and verification18 / 21
The monitoring plan
- By the expert, on the project scenario
What the practice asks for
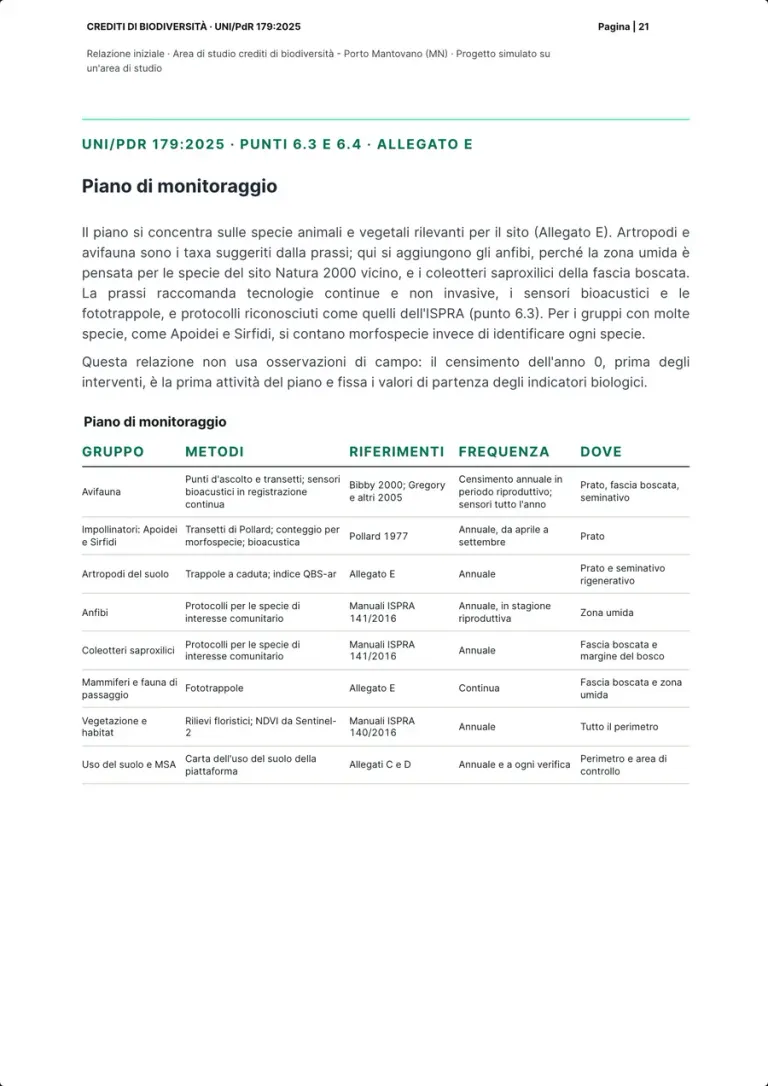
Arthropods and birds as the suggested taxa; bioacoustic sensors and camera traps recommended; ISPRA protocols (section 6.3, Annex E).
How the report shows it
Eight groups with method, references, frequency and place: birds with listening points and bioacoustic sensors all year round, pollinators with Pollard transects, soil arthropods with the QBS-ar index, amphibians and saproxylic beetles with the ISPRA manuals 141/2016, camera traps for mammals. The year 0 census sets the starting values.
Who does it Team expert: zoologist and botanist
Real page · simulated project on a study site · p. 21/26 Monitoring and verification19 / 21
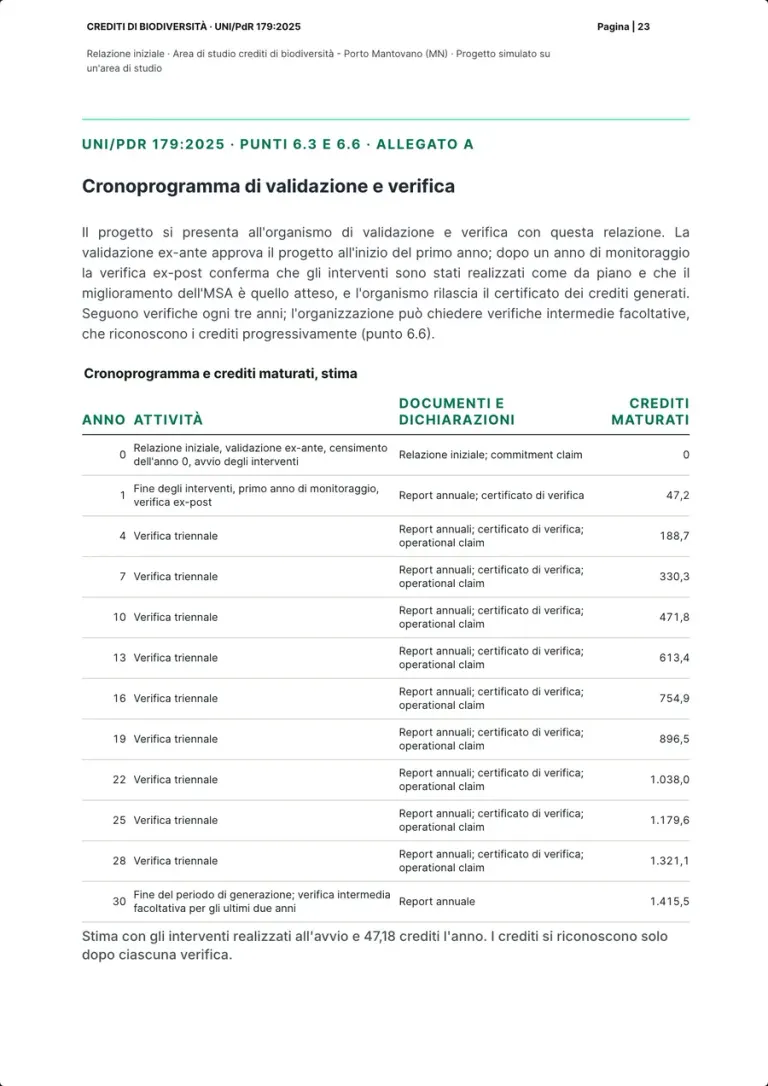
Validation, verifications and credits accrued
- By the expert, on the project scenario
What the practice asks for
Ex-ante validation, ex-post verification after one year of monitoring, then three-yearly verifications, with a yearly certificate of the credits generated (sections 6.1, 6.3 and 6.6); for certification, the accredited validation and verification body (section 6.6, Annex A).
How the report shows it
Year by year, the activities, the documents and the credits accrued: 47.2 after the ex-post verification of year 1, 188.7 at the first three-yearly verification in year 4, 1,415.5 in year 30. The estimate assumes the actions are in place at the start: credits are recognised only after each verification.
Who does it Team expert; validation and verification belong to the body
Real page · simulated project on a study site · p. 23/26 Claims and sources20 / 21
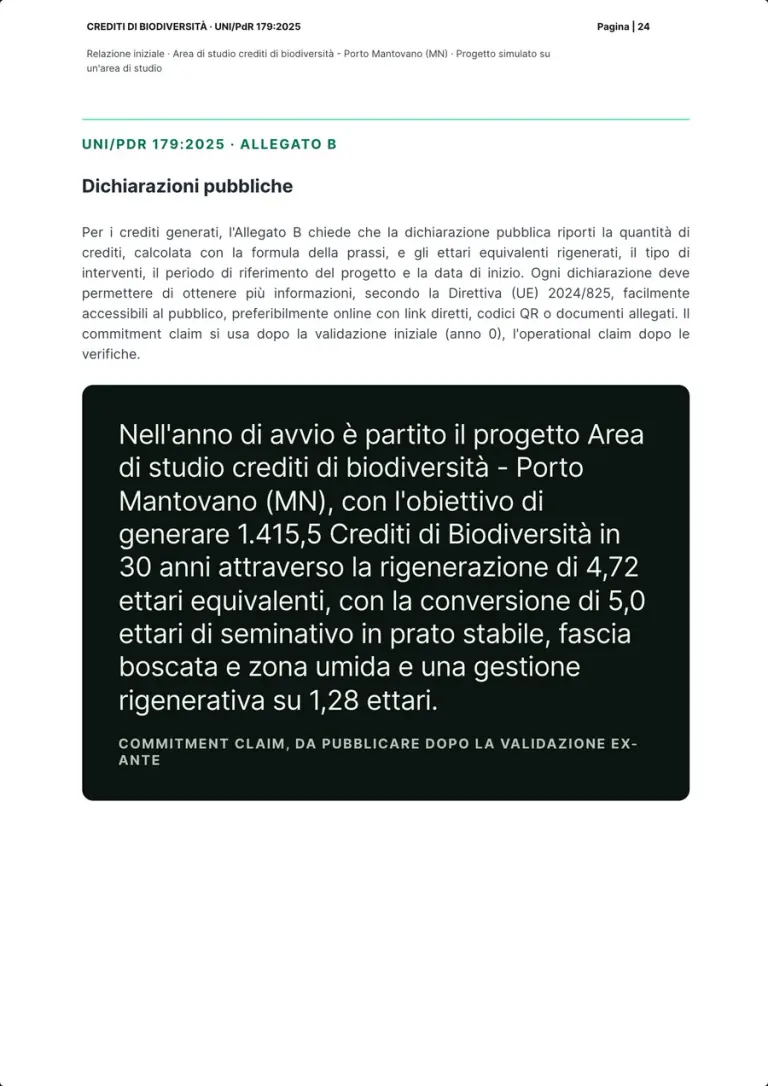
The public claims
- By the expert, on the project scenario
What the practice asks for
A commitment claim in year 0 and an operational claim after the verifications, with credits generated, equivalent hectares, type of action, period and start date, and information accessible to the public (Annex B, EU Directive 2024/825).
How the report shows it
The text of Annex B and the commitment claim ready to publish after the ex-ante validation: 1,415.5 Biodiversity Credits over 30 years, 4.72 equivalent hectares regenerated, 5.0 hectares converted into permanent meadow, woodland strip and wetland and 1.28 under regenerative management.
Who does it Team expert
Real page · simulated project on a study site · p. 24/26 Claims and sources21 / 21
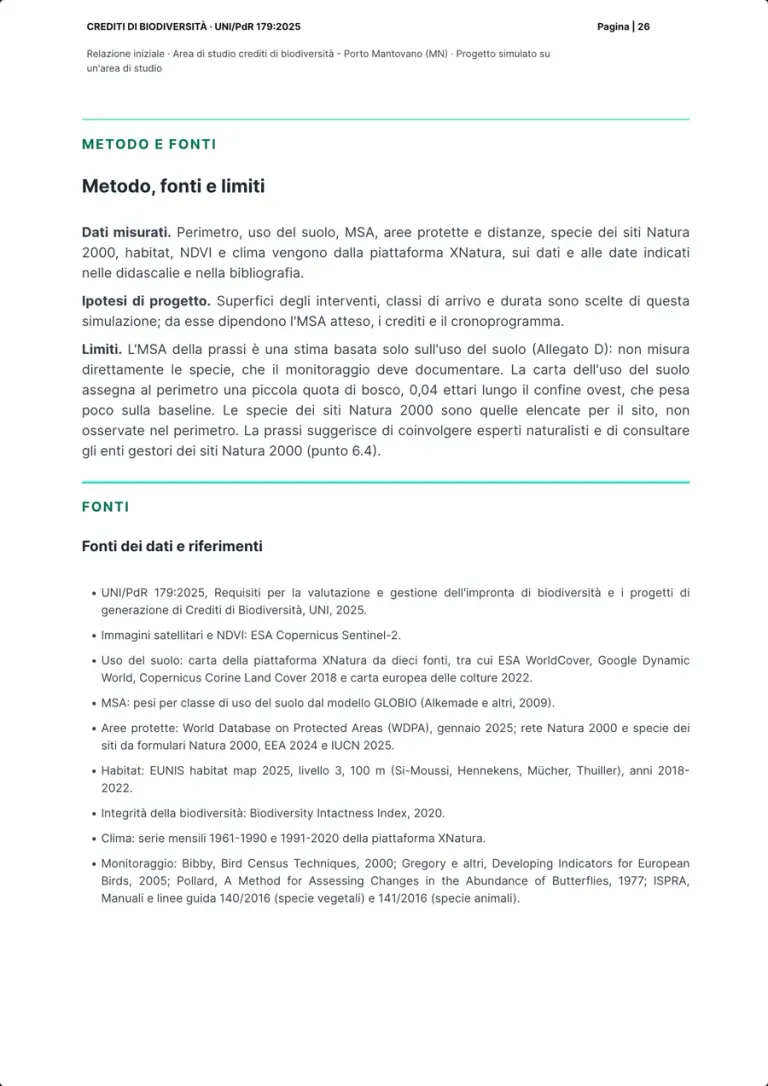
Method, sources and limits
- By the expert, on the project scenario
What the practice asks for
An expert with a degree in natural, biological or agricultural sciences, environmental engineering or related fields is recommended (sections 4 and 6.4).
How the report shows it
The report separates what is measured (perimeter, land use, MSA, protected areas, species, habitats, NDVI, climate) from the project assumptions, and states the limits: MSA is an estimate from land use, and the species are for the monitoring to document. Then the bibliography, from the practice to the ISPRA manuals.
Who does it Team expert
Real page · simulated project on a study site · p. 26/26
How the baseline is made
From land use to the site's MSA.
The baseline of a credit project is calculated from land use: each class has an MSA weight, and the site's MSA is the average of the weights over the surfaces. The report calculates it on the perimeter and on the control area around it.
Satellites and datasets
Open imagery and maps, updated over time.
One class per pixel
The platform's map combines ten sources and goes down to the single crop, with 10 metre pixels. Annex C asks for at least 15 metres and 6 classes.
0-1 an MSA weight per class
The GLOBIO weights: 0.1 for intensive arable land, 1 for natural meadow, plus 0.2 for regenerative practices (Annex D).
The average over the surfaces
The study perimeter's MSA is 10.6 per cent, the control area's 41.1: the starting point of the credits.
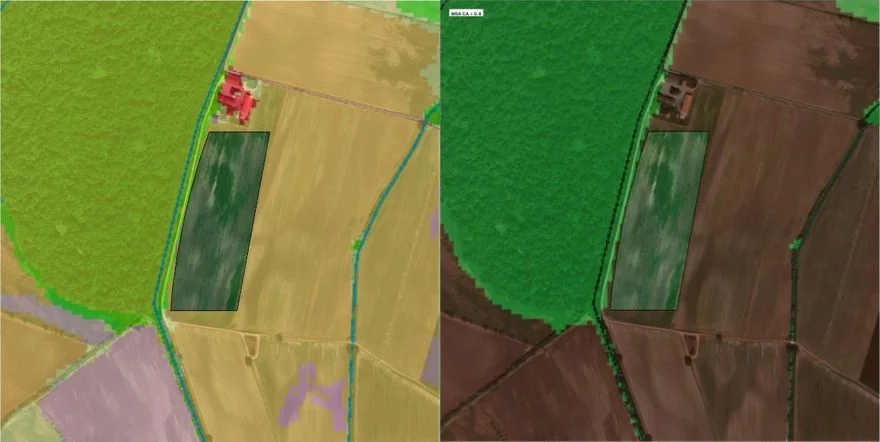
Same area, two layers
Switch the layer, the perimeter stays put.
The two maps come from the report above, pages 10 and 12, cropped to the same scale: the 1 km control area with the project perimeter. Where land use is woodland, MSA is close to 1; on arable land it is low.

Land Use 
Natural Habitat Coverage 
MSA (Mean Species Abundance) 
MSA Fragmentation 
Protected Areas 
Water Coverage 
PA Relative Pollinator Abundance 
Observations
Indicator cards of the XNatura platform, from the site's Satellite maps page. The platform's satellite maps
In the field with Biodiversa
The satellite gives the baseline. The field gives the species.
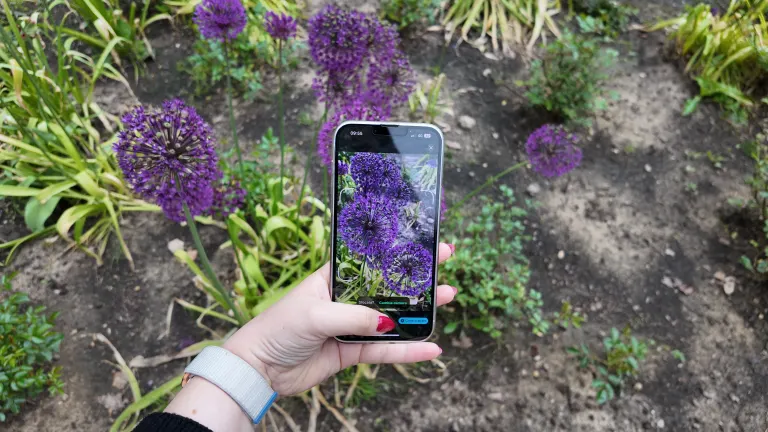
The practice suggests arthropods and birds as the taxa, recommends bioacoustic sensors and camera traps, and ISPRA protocols (section 6.3, Annex E). The survey is done with the Biodiversa app: every observation with its species, position and photo, straight into the platform.
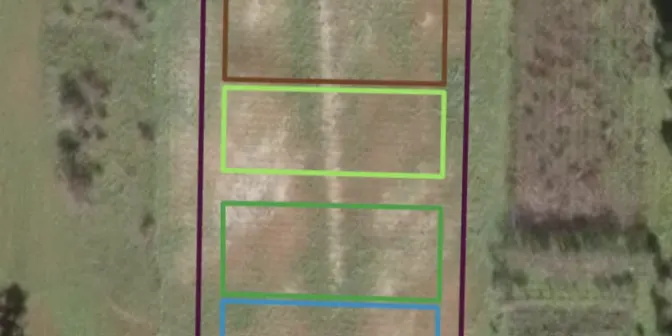
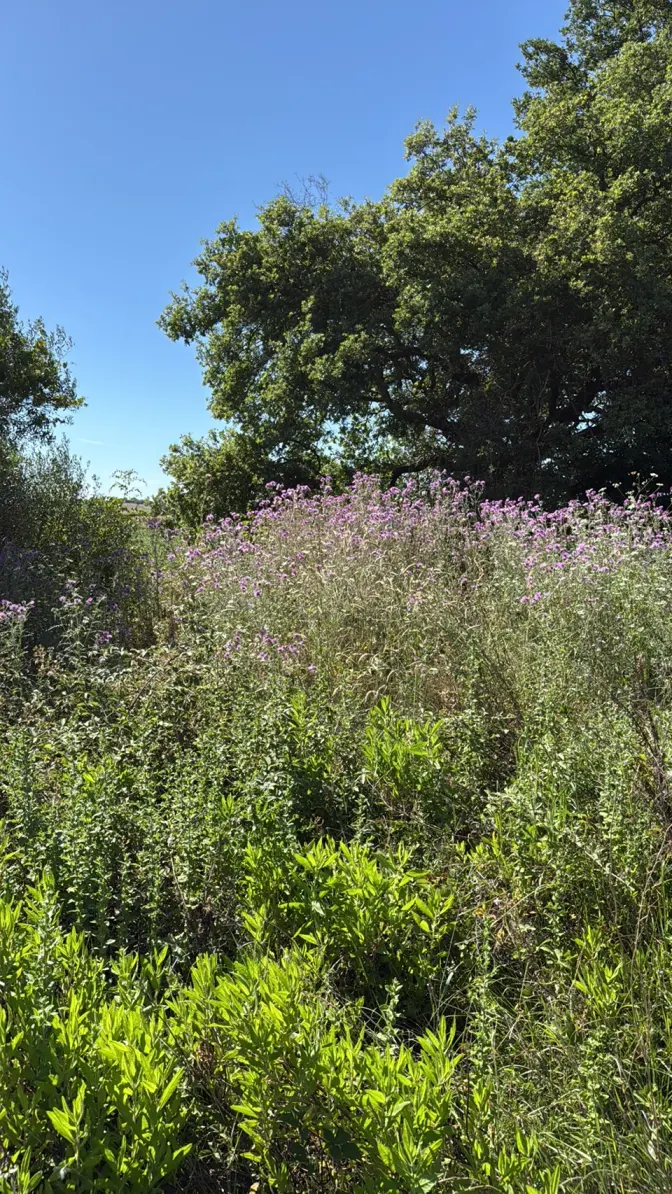
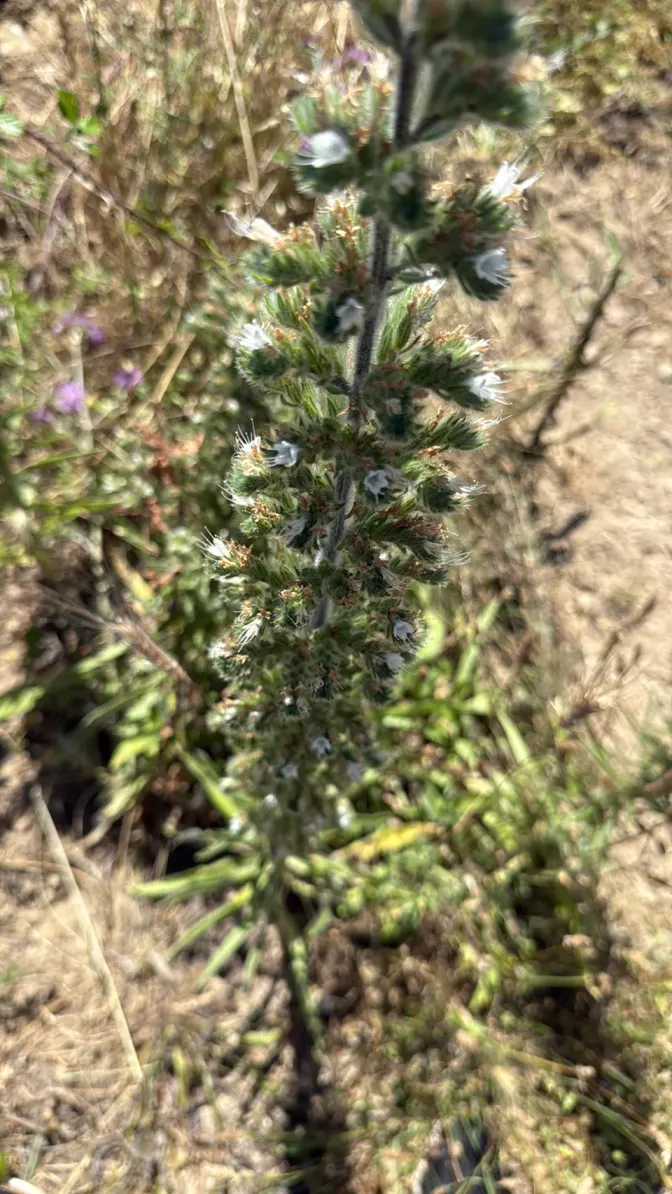
- FieldSurvey with the app
- CheckValidated by the expert
- DataCensus observations
- ReportThe record shows up in the report
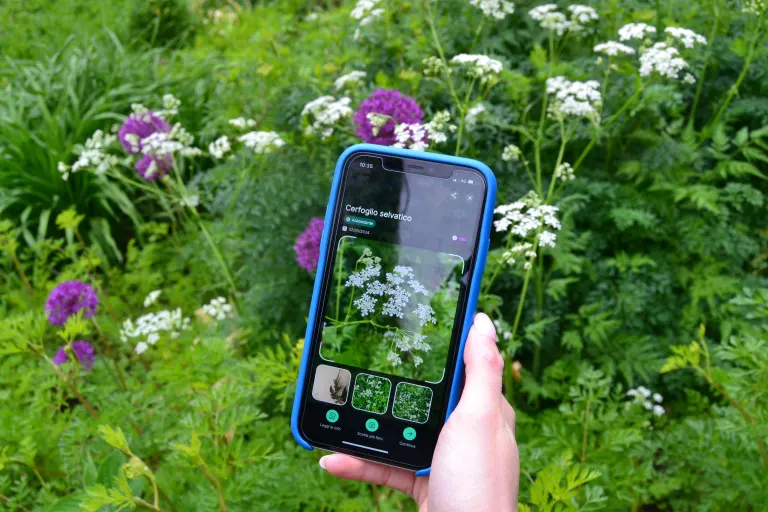
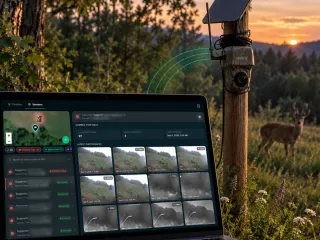
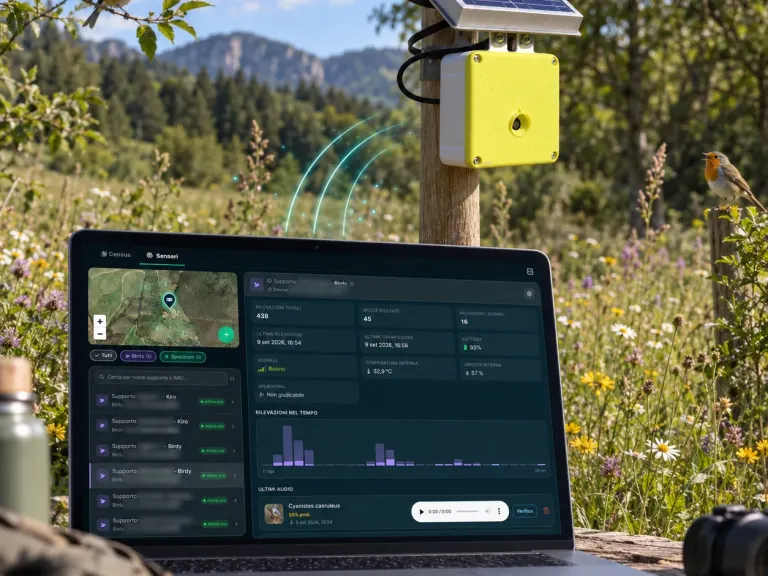
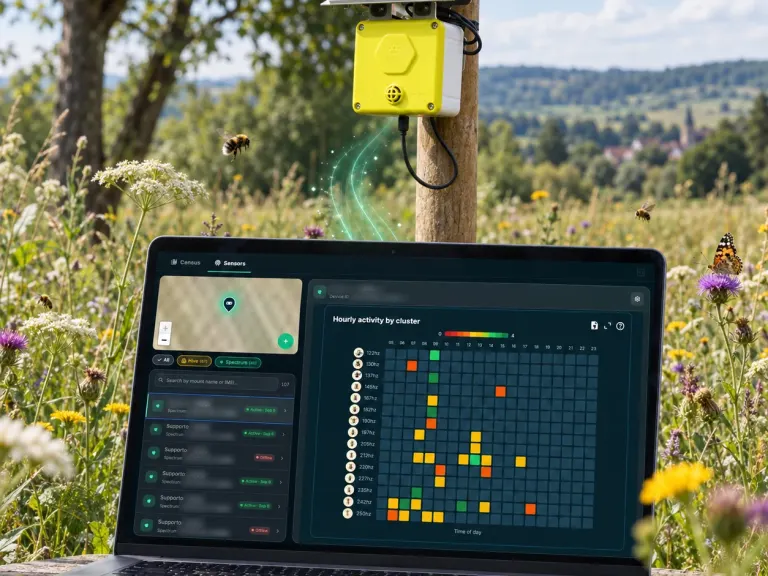
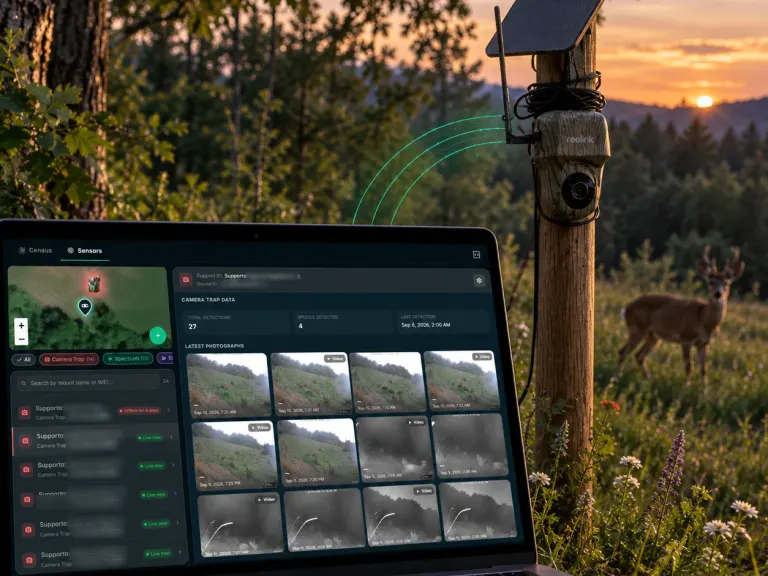
Bioacoustic sensors and camera traps
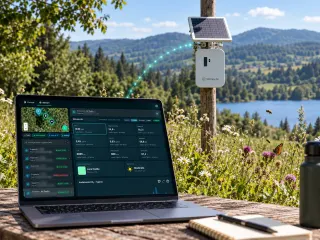
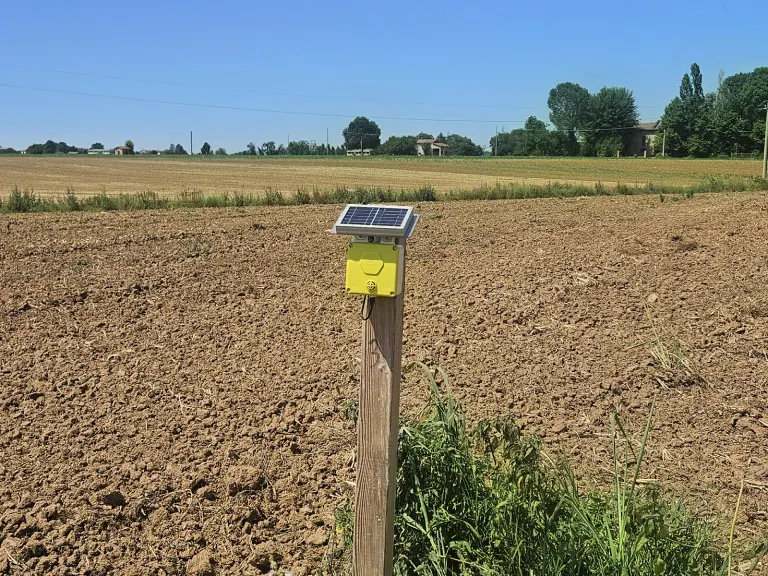
They work continuously, without disturbing, and their data end up in the platform next to the Biodiversa surveys.
UNI/PdR 179:2025, section 6.3 and Annex E
The Nature Experts
The platform prepares the data. The expert signs.
The practice recommends an expert with a degree in natural, biological or agricultural sciences, environmental engineering or related fields: our Nature Experts prepare baseline, plan and monitoring on the platform's data.
- 01PrepareLand use, MSA, protected areas and species from the platform
- 02DesignThe expert chooses actions and targets and calculates the credits
- 03DocumentInitial report and annual reports, for the body that validates and verifies
- 40+in-house nature, climate and ESG specialists
- 7disciplines under one roof
- UNI/PdR 179Italian biodiversity standard, project leader (2025)
Who works on a credit project
Ecologist
Reads the baseline and the Natura 2000 network, chooses the actions and the target species, calculates the credits on the expected MSA.
Botanist
Meadow, woodland and wetland: composition, plant surveys, habitats to restore.
Zoologist
Birds, pollinators, amphibians: the year 0 census, bioacoustic sensors and camera traps.
Validation and verification body
Independent: validates the project, verifies the credits and issues the certificate. That is not us.
Proponent
Carries out the actions and maintains them for the whole duration of the project, 15 to 30 years.
The team's disciplines
 Ecology & biodiversityBiologists, faunal zoologists, environmental engineers: baselines, surveys, camera traps, bioacoustics, telemetry.
 Assessment, reporting & complianceESRS E4, BNG, SBTN, GRI, EIA/SEA, VIncA, BREEAM/LEED. Board- and authority-ready.
 Agronomy & land useRegenerative agriculture, supply chains, land and vegetation management.
 Data & remote sensingGIS, satellite analysis, IoT data, predictive models, digital twinning.
 Climate & riskIPCC scenarios, physical risk, wildfire and water modelling per asset.
 Strategy & deliveryNature strategy, action plans, green finance, stakeholder engagement, client training.

The context
An Italian practice, inside a market that is taking shape.
UNI/PdR 179:2025
In force since 23 September 2025, a voluntary reference practice: biodiversity footprint (section 5) and credit generation (section 6), with first, second or third-party conformity assessment: certification is the third-party one.
The IAPB principles
The practice takes into account the High-Level Principles for Biodiversity Credit Markets of the International Advisory Panel on Biodiversity Credits.
The European Roadmap
On 7 July 2025 the European Commission published its Roadmap towards Nature Credits. Niccolò Calandri sits on the Commission's Nature Credits Expert Group.
Fair claims
Every claim on footprint or credits must come with information the public can access, as EU Directive 2024/825 requires.
UNI/PdR 179:2025, Annex B
The voice that guides you through the report
Ask, and the page takes you there.
A voice assistant always within reach, bottom right. Ask it about a section of the report, how a credit is calculated or who does what: it answers and brings the page to the right point.
- It answers about this page: UNI/PdR 179:2025, the life of a credit, what each section of the report shows.
- It walks you through the document: it scrolls to the section and highlights it while you keep talking.
- If you want a first analysis of your site on the platform, it prepares it, and you open it on XNatura after signing in.
You can ask, for example
- Take me to the credit calculation
- What does the practice ask for the baseline?
- How long does a credit project last?
- Who certifies the credits?
- I'd like a first analysis of my site on the platform
Contact
Have land to regenerate, or credits to find?
Tell us about the land, the actions you have in mind and your timing. A strategist with a name replies within 24 working hours.
30 minutes with the XNatura team
Video call on Google Meet
Would you rather talk it through?
Either way you are speaking with an AI assistant, and the conversation is transcribed. How we handle your data
Tell us about the land
Request sent.
One of our strategists replies within 24 working hours. If you need us sooner, write to info@3bee.com.
Our systems are temporarily unreachable and the request did not go through. Try again, or write to info@3bee.com.
FAQ
Frequently asked questions on Biodiversity Credits
What is UNI/PdR 179:2025?
A voluntary UNI reference practice, in force since 23 September 2025: the requirements for assessing and managing the biodiversity footprint and for projects that generate Biodiversity Credits. We led the table that wrote it, with the University of Naples Federico II, the University of Turin, CREA and Climate Standard.
What is a Biodiversity Credit and how is it calculated?
The certificate of one unit of measured biodiversity improvement, based on evidence, durable and additional (section 3.13). It is calculated as BC = ΔMSA × hectares × years × 10: one credit equals 0.1 hectares (1,000 m²) of full ecological regeneration for one year. In the practice's own example, 3 hectares from intensive farming (MSA 0.1) to natural meadow (MSA 1) generate 27 credits a year, 810 over 30 years (section 6.2).
How long does a project last, and when are the credits verified?
15 to 30 years (sections 6.2 and 6.3). The project is validated ex ante, verified ex post after one year of monitoring and then every three years, with a yearly certificate of the credits generated (sections 6.1, 6.3 and 6.6). Validation can be retroactive up to 3 years, and buyers use the credits for 5 years (section 6.3).
Do you certify the credits?
No. Conformity with the practice can be assessed by a first, second or third party; certification needs an independent validation and verification body, which must be accredited if the practice goes through Accredia (sections 3.20 and 6.6, Annex A). Until a public registry exists, the body manages each project's identifier and each credit's code (section 6.3). We prepare the report, the data and the monitoring: we are neither the validation and verification body nor a registry.
Which data does the baseline need?
Land use, with data at a resolution of at least 15 metres and at least 6 classes, for example Corine Land Cover, ESA WorldCover or Dynamic World (Annex C), and the MSA of each class with the GLOBIO weights, plus 0.2 for regenerative practices (Annex D). The baseline also takes into account historical, biogeographical and Natura 2000 data (section 6.4).
How is a project monitored?
The practice suggests arthropods and birds as the taxa, recommends bioacoustic sensors and camera traps, and ISPRA protocols (section 6.3, Annex E). We use the Birdy sensor for birds, Spectrum for pollinators, camera traps and the Biodiversa app for surveys, with all the data in the platform.
Is the project on this page real?
The report is real in its form: generated with the platform from the template for the initial report of UNI/PdR 179:2025, on a real study site at Porto Mantovano (MN). The project is simulated: the baseline is measured, the actions and the credits are a project assumption. No client, no person, no credit validated or issued.
XNatura · AI
Voice assistant
Ask me about a section of the report, the life of a credit or who does what: I'll take you where you need to be.
You can ask, for example
- Take me to the credit calculation
- What does the practice ask for the baseline?
- How long does a credit project last?
- Who certifies the credits?
- I'd like a first analysis of my site on the platform
You’ll speak with XNatura’s AI assistant. Your microphone only starts with your permission. You can review and confirm your details before sending a request. If the assistant prepares a demo for you, the site’s name and location go to the XNatura platform, which keeps them for one hour so you can open it. How we use your data
Getting your conversation ready…
The conversation
Start with a question or tell us what you need.
Your project updates as you speak
Review and send your request