




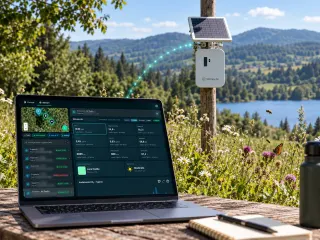

Four technologies
Satellite Maps for Environmental and Territorial Monitoring
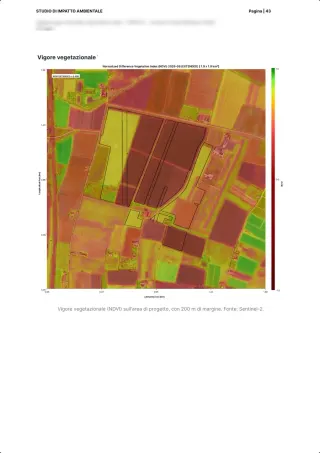
Our satellite maps provide detailed analysis of the environment, climate, biodiversity, and risks. Explore the main categories and discover how this information can support sustainable decisions.

01 / 06
Explore Interactive Maps for Environmental Monitoring
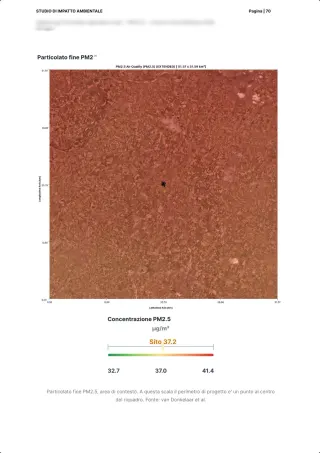
XNatura satellite maps analyze the environment, territory, climate, and biodiversity in real time. View geospatial data, monitor changes, and make informed decisions on environmental impacts, risks, and opportunities.
- 01
Land Use
Analysis of land and its natural and artificial coverage. - 02
Density and Urbanization
Study of urban growth and population distribution. - 03
Climate Interaction
Monitoring of climate change and weather conditions. - 04
Interaction with Nature
Exploration of biodiversity and protected species. - 05
Environmental Risks
Identification of natural risks and monitoring of environmental quality.
02 / 06
Land Use
Analyze how the land is used and its changes over time, including natural and artificial areas.
- 01
Land Use
The 'Land Use' map shows the division of land into various categories, including agricultural crops, urban areas, and natural areas. It provides a comprehensive overview of land use, highlighting how the territory is exploited for agricultural, residential, and industrial activities, and where natural habitats remain. - 02
KPIs: Land Use
Land use is the classification of different types of land based on human activities and vegetation cover. This indicator provides information on land use in the monitored area, showing the distribution of various land types and the presence of natural and human-modified habitats. - 03
Natural Habitat Coverage
The 'Natural Habitat Coverage' map shows the distribution of natural habitats, such as forests, wetlands, and grasslands, and analyzes their changes over time. It is an essential tool for monitoring ecosystem health and the effectiveness of nature conservation policies. - 04
KPIs: Natural Habitat Coverage
Natural habitat coverage is an indicator of the presence and extent of natural areas within the study area. This indicator provides information on biodiversity and the presence of natural habitats, showing how conserved or degraded an area is. Data refers to the year 2025. - 05
Impervious Land Ratio
The 'Impervious Land Ratio' map analyzes the percentage of land that is impermeable, such as asphalt, concrete, and other artificial surfaces. This is a key indicator for understanding how urbanization affects natural water drainage and flood risk. - 06
KPIs: Impervious Land Ratio
The ratio of impervious to permeable land is an indicator of the soil's ability to absorb water and support vegetation. This indicator shows how susceptible an area is to flooding and arid conditions. Data refers to the year 2025. - 07
Water Coverage
The 'Water Coverage' map shows the distribution of water-covered surfaces, such as rivers, lakes, and reservoirs. It is essential for monitoring available water resources and assessing the impact of human activities and climate change on water resources. - 08
KPIs: Water Coverage
Water coverage is an indicator of the presence and extent of water bodies within the study area. Data refers to the year 2025.
03 / 06
Density and Urbanization
The maps under the 'Density and Urbanization' category analyze the evolution and distribution of built-up areas and population across the territory. These maps provide a detailed view of urban expansion, population density, and the impact of urbanization on the environment and quality of life.
- 01
Built-Up Surface
The 'Built-Up Surface' map shows the areas of the territory transformed into urban or industrial spaces, such as buildings, roads, and infrastructure. This map helps visualize city expansion and landscape transformation, useful for assessing environmental impact and planning future development. - 02
KPIs: Built-Up Surface
The built-up surface is the amount of land covered by buildings, roads, and other human infrastructure. This indicator provides information on anthropogenic pressure on the environment and natural habitats, showing how urbanized or inhabited an area is. - 03
Population Density
The 'Population Density' map shows the distribution of the population across different areas, highlighting zones with high population density. This information is crucial for understanding urbanization dynamics, pressure on local resources, and planning public services. - 04
KPIs: Population Density
Population density is the number of people living in a specific area, expressed as inhabitants per hectare. This indicator provides information on anthropogenic pressure on the environment and natural habitats, showing how urbanized or inhabited an area is.
04 / 06
Climate Interaction
The 'Climate Interaction' category provides a detailed view of climate variables affecting the territory, such as temperature, rainfall, precipitation, and aridity. The maps in this section help monitor climate change and its effects on ecosystems and human activities, contributing to planning for climate risk management and sustainability.
- 01
Aridity
The 'Aridity' map visualizes areas subject to drought and aridity, indicating levels of water scarcity and areas with water stress. It is an essential tool for water resource management and preventing water crises. - 02
KPIs: Aridity
The aridity index is the ratio of average annual precipitation to potential evapotranspiration, indicating how arid an area is. A low value indicates difficulty in supporting vegetation and biodiversity. - 03
Land Surface Temperature
The Land Surface Temperature (LST) layer represents the measurement of the earth's surface temperature. This indicator helps monitor the effects of climate change. - 04
KPIs: Land Surface Temperature
Land Surface Temperature (LST) is the measurement of the earth's surface temperature and can vary significantly from air temperature. Monitored in degrees Celsius (°C), LST provides a direct indication of the effects of global warming and climate change on the earth's surface.
05 / 06
Interaction with Nature
The 'Interaction with Nature' category explores the relationship between natural ecosystems and the species that inhabit them, with a particular focus on biodiversity, pollinators, floral availability, and protected areas. The maps in this section provide a powerful tool for monitoring ecosystem health, promoting conservation, and improving environmental management practices.
- 01
MSA (Mean Species Abundance)
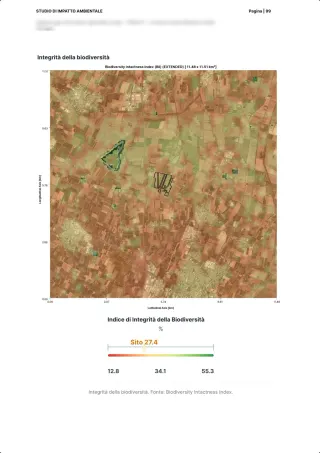
The Land Cover MSA map visualizes the distribution and abundance of monitored species through the MSA (Mean Species Abundance) index, an ecological parameter that measures the density of selected species in a given territory. This map is useful for monitoring ecological balance and the effectiveness of conservation policies, with a focus on key species that represent ecosystem health and diversity. - 02
KPIs: MSA (Mean Species Abundance)
MSA Land Use (LU) is an indicator of biodiversity integrity, defined as the average abundance of original species compared to their abundance in undisturbed ecosystems, specifically considering land use. - 03
MSA Infrastructure
Refers to the average amount of a given species (plants, animals, or other organisms) present in a built environment, such as parks, urban gardens, corporate green areas, or green infrastructure. - 04
KPIs: MSA Infrastructure
Helps understand the effectiveness of a project in promoting a rich and diverse ecosystem and can be a crucial indicator in environmental sustainability and natural regeneration strategies. - 05
MSA Fragmentation
The map represents the relationship between biodiversity (in terms of species abundance) and the degree of habitat fragmentation. - 06
KPIs: MSA Fragmentation
Represents a measure to assess how habitat fragmentation affects the abundance and distribution of species in a specific area, such as an urban ecosystem or green infrastructure. - 07
MSA Animals
The map represents the distribution and average density of different animal species in a specific environment or ecological area. This layer provides detailed information on the presence and quantity of animals (such as mammals, birds, reptiles, insects, etc.) in a specific area. - 08
KPIs: MSA Animals
Average number of individuals of an animal species present in a specific environment or ecological area. This indicator is useful for assessing animal population density and monitoring biodiversity in a given context. - 09
MSA Plants
The map represents the distribution and average density of plant species in a specific environment or ecological area. This layer provides information on the quantity and diversity of plant species in an ecosystem. - 10
KPIs: MSA Plants
Measures the density and distribution of plant species in a defined area, helping to monitor biodiversity and the ecological health of the landscape. - 11
PA Relative Pollinator Abundance
The 'Land Cover PA' map shows the abundance of pollinators in different areas of the territory. Using satellite imagery and spatial analysis, this map highlights areas with a higher concentration of pollinators, crucial for the health of agricultural and natural ecosystems. - 12
KPIs: PA Relative Pollinator Abundance
Final index obtained that measures the potential habitat suitability for pollinators for a specific map pixel. - 13
PN Nectar Potential
The 'Land Cover PN' map visualizes the availability of nectar in different areas, useful for understanding the potential of plants to support pollinators. The map helps monitor areas where flowering potential and nectar production are highest, influencing the health and productivity of pollinators. - 14
KPIs: PN Nectar Potential
Nectar potential represents the potential amount of nectar produced in a given area. It is calculated by identifying the species present in the area and calculating their potential contribution, which varies for each plant species. - 15
FA Floral Availability
The 'Land Cover FA' map indicates the availability of flowers for pollinators. By monitoring floral coverage, this map helps understand where pollinators find floral resources to feed, essential for their survival. - 16
KPIs: FA Floral Availability
Visual representation of the distribution and density of flowering vegetation in a specific geographic area. - 17
NS Suitability for nesting
The 'Land Cover NS' map highlights pollinator nesting areas, such as areas of soil suitable for building nests for bees and other insects. These areas are fundamental for the reproduction and conservation of pollinator species. - 18
KPIs: NS Suitability for nesting
Shows the presence of areas where nesting sites can be found. - 19
Observations
The 'Observations' map collects direct observations of fauna and flora, allowing monitoring of species presence in specific areas. Observations are a useful tool for citizen science and ecological research, contributing to real-time biodiversity data collection. - 20
KPIs: Observations
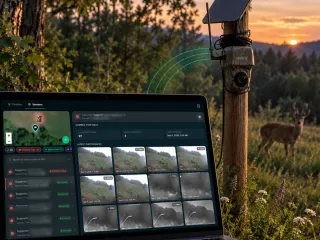
KPIs related to observations provide essential information for monitoring biodiversity and analyzing species evolution over time. Data is collected through platforms like Biodiversa, INat (the citizen science platform), and advanced technological devices like camera traps, which enable real-time observations from natural environments. - 21
Protected Areas
The 'Protected Areas' map visualizes conservation and biodiversity protection areas, such as natural parks, reserves, and special protection zones. These areas are fundamental for maintaining biodiversity and protecting threatened species. - 22
KPIs: Protected Areas
Extent and distance of protected areas from the site. Protected areas are geographic areas managed for biodiversity and natural resource conservation. The presence of protected areas near the site can positively influence local biodiversity but requires greater attention to the negative effects the site may have. Square areas of 25 km are mapped, so the maximum diagonal distance is 35.5 km.
06 / 06
Risks
The 'Risks' category focuses on monitoring various types of natural risks that can affect the territory and people, such as hydrogeological risks. The maps in this section provide essential tools for identifying areas vulnerable to natural phenomena, such as landslides, floods, and other water-related emergencies, and for planning mitigation and prevention strategies.
- 01
Hydrogeological Risk
The 'Hydrogeological Risk' map visualizes areas vulnerable to landslide, erosion, and flood risks. Using geospatial and satellite data, this map helps identify areas most likely to experience hydrogeological events, contributing to urban planning and emergency management. - 02
KPIs: Hydrogeological Risk
Hydrogeological risk is expressed on a scale from 1 to 5, where 1 indicates low risk and 5 represents extreme risk. This index is calculated by analyzing the intensity and frequency of events in the watershed since 1985. The risk of landslides and erosion is calculated as the sum of landslide events recorded since 1985, each multiplied by a severity factor from 1 to 2. It ranges from 1 (minimum risk) to 5 (maximum risk). - 03
Heat Islands
The selected layer, Urban Heat Island Index (UTFVI), measures the intensity of heat islands in urban areas, providing insights into the impact of human activities on the local climate. - 04
KPIs: Heat Islands
The KPI of the heat island index is an indicator of the average temperature of an area compared to its surroundings. - 05
Extreme Events
The selected layer, catastrophic events, shows the presence of extreme events such as earthquakes, floods, tropical cyclones, volcanic eruptions, droughts, and fires near the site. These data are essential for assessing risk and adopting protective measures.
Technology
Satellite Maps for Environmental and Territorial Monitoring

FAQ
Frequently asked questions
What are XNatura’s products and services?
XNatura offers advanced solutions for environmental monitoring and analysis, designed to support companies, municipalities, and natural parks in sustainable land management. The main products and services include: Data-driven analysis platform: integrates data from sensors, satellite maps, satellite imagery, and artificial intelligence to provide interactive maps and real-time KPIs. Nature, climate, and biodiversity monitoring: customized solutions for controlling environmental parameters such as air quality, water resources, and ecosystem health. ESG compliance tools: support in data collection and analysis to ensure compliance with environmental and sustainability regulations. Tailored plans: customized strategies based on company objectives and environmental context to optimize interventions and maximize results.
What is Satellite Maps for Environmental and Territorial Monitoring?
Our satellite maps provide detailed analysis of the environment, climate, biodiversity, and risks. Explore the main categories and discover how this information can support sustainable decisions.
How does XNatura use Satellite Maps for Environmental and Territorial Monitoring?
Explore Interactive Maps for Environmental Monitoring. XNatura satellite maps analyze the environment, territory, climate, and biodiversity in real time. View geospatial data, monitor changes, and make informed decisions on environmental impacts, risks, and opportunities. Land Use: Analysis of land and its natural and artificial coverage. Density and Urbanization: Study of urban growth and population distribution. Climate Interaction: Monitoring of climate change and weather conditions. Interaction with Nature: Exploration of biodiversity and protected species. Environmental Risks: Identification of natural risks and monitoring of environmental quality.
Want to Improve Biodiversity at Your Company Sites?
Contact us to assess and monitor the biodiversity of your sites with XNatura.