




EIA · EIS · Appropriate Assessment · Monitoring
In Italy a state EIA takes a median of 2.7 years, and 21 in 100 end with a negative opinion.
Here is how we build your Environmental Impact Assessment, section by section: data measured from satellite and in the field, signed by ecologists.
- 2,967projects in the MASE catalogue
- 619EIAs concluded with a known outcome
- 34EIA screenings concluded with a known outcome
Measured on 6 October 2026, MASE catalogue
EIA in numbers
How long it really takes, and how it ends.
From the "Projects and authorisations" catalogue built on the Environmental Assessments portal of MASE, the Italian Ministry of the Environment. Concluded procedures only: the green bar is the middle half of the cases, the line is the median.
- Middle half (p25-p75)
- Median
- Mean
EIA
PNIEC-PNRR regime540 concluded
982 days2.7 years760-1,218 · mean 983
Ordinary regime97 concluded
1,087 days3.0 years827-1,376 · mean 1,178
PUA
PNIEC-PNRR regime48 concluded
1,191 days3.3 years1,010-1,383 · mean 1,178
Ordinary regime19 concluded
1,308 days3.6 years1,051-1,541 · mean 1,325
EIA screening
Ordinary regime24 concluded
287 days0.8 years178-400 · mean 302
PNIEC-PNRR regime12 concluded
249 days0.7 years230-270 · mean 249
Outcomes of concluded EIAs
619 procedures with a known outcome
- Positive with conditions
- Negative
- Positive without conditions
Outcomes of EIA screenings
34 procedures with a known outcome
- Excluded from the EIA
- Referred to an EIA
- Other outcomes
- About 9 months to learn whether an EIA is neededThe median ordinary screening takes 287 days, the PNIEC-PNRR one 249. 62 screenings in 100 end with the project excluded from the EIA.
- 3.0 years for an ordinary EIAMedian 1,087 days, and one case in four takes longer than 1,376 days. Under the PNIEC-PNRR regime the median is 982 days.
- 71 EIAs in 100 come with conditionsThey are obligations to meet after the decree, often monitoring ones. More on that below.
Groups with fewer than 10 procedures are not shown.Explore every project
The report, page by page
The EIA, section by section.
The pages are real: they come from two of our reports for a solar plant, anonymised and published as examples (the site simulation for an EIA and the answer to the conditions of an appropriate assessment), plus a multi-site comparison for the alternatives. For each section: what the authority asks for, how we produce it and how much of it is automated.
How much is automated
- Measured automatically
- Worked out by the expert on our data
- With a specialist partner
6 sections out of 15 measured automatically, 7 worked out by the expert on our data, 2 from the proponent or with a partner. Either way, an expert signs the document.
Opening01 / 15
Non-technical summary
- Worked out by the expert on our data
What the authority asks for
A summary anyone can read: the project, the area, the expected effects and the measures, without jargon. It is the page the commission and the public read.
How we produce it
We take the key figures from the project and set them beside the baseline values measured on the site: land use, MSA, protected areas, risks. The expert writes the text and checks that every number has its source.
Signed by Ecologist
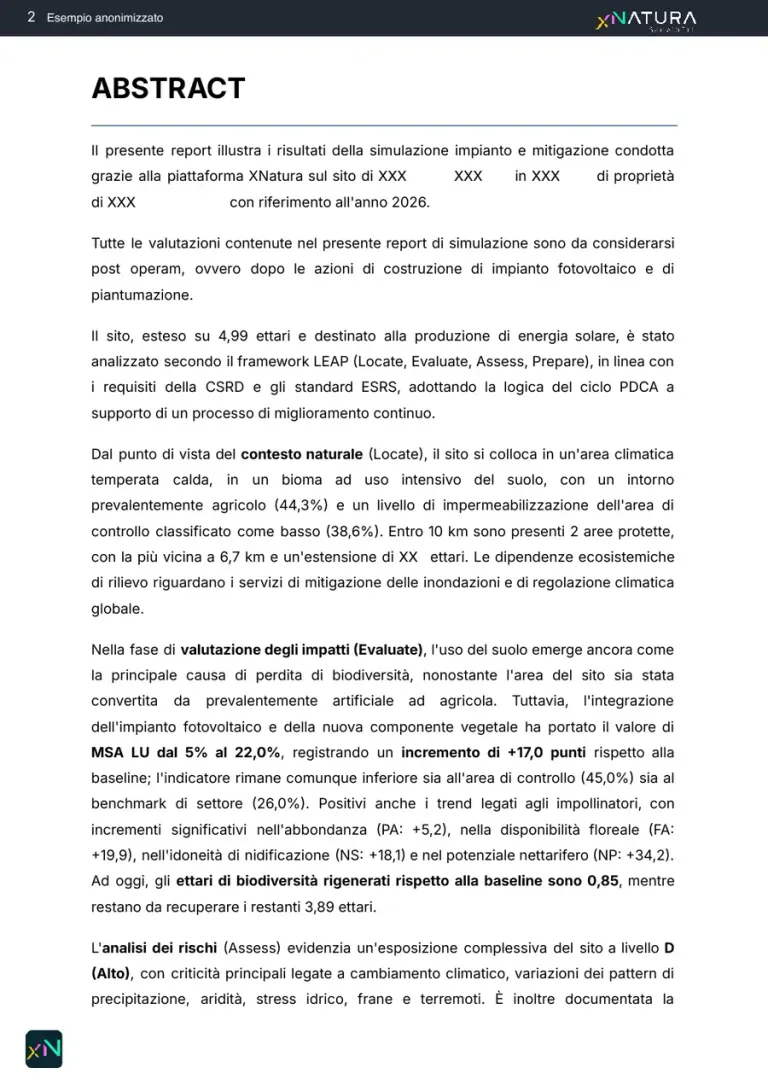
Pre- and post-construction simulation for an EIApage 3 of 40 · PDF in ItalianDownload the report Planning framework02 / 15
Planning framework and constraints
- Worked out by the expert on our data
What the authority asks for
How the project relates to planning and constraints: protected areas, landscape and hydrogeological constraints, zoning instruments.
How we produce it
We compute the distances to protected areas, settlements and watercourses automatically: the table comes out of the data. The consistency check against each plan is the expert's, instrument by instrument.
Signed by Compliance expert
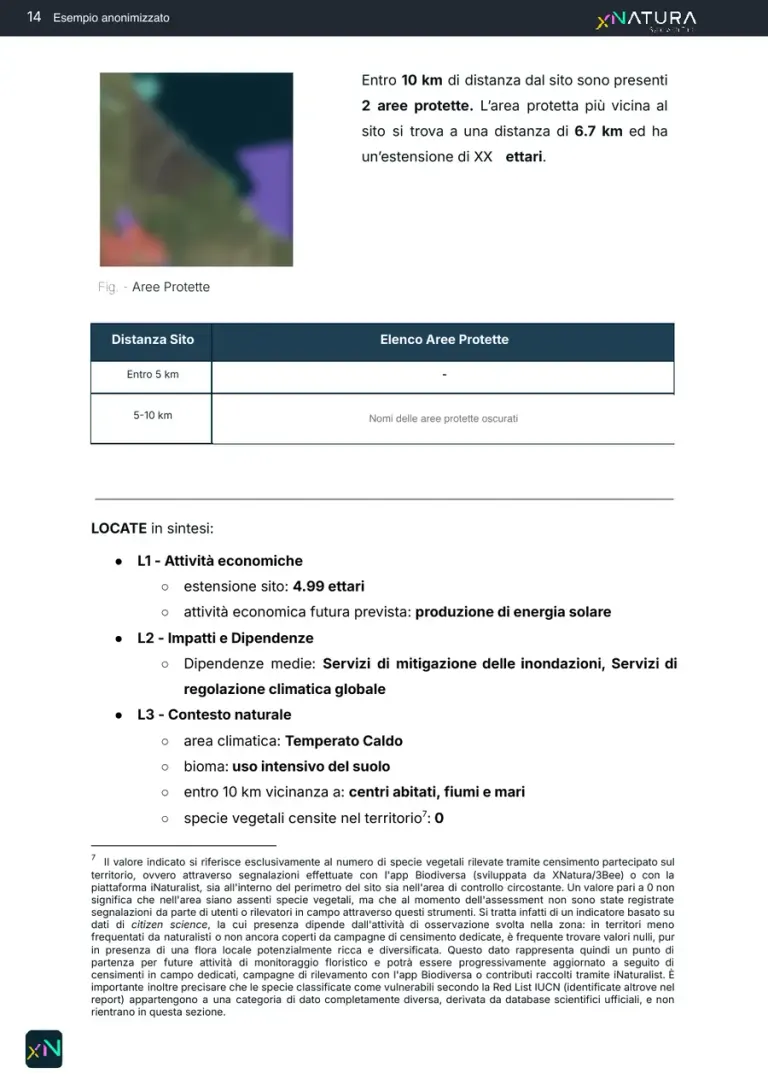
Pre- and post-construction simulation for an EIApage 15 of 40 · PDF in ItalianDownload the report Project framework03 / 15
Project description
- Data from the proponent
What the authority asks for
The technical description of the project: size, technologies, construction, operation and decommissioning.
How we produce it
The project's data belong to the proponent and stay theirs: we use them. On this page the plant's perimeter and layout size the mitigation hedge along the 2,200 m of fence.
Signed by Proponent
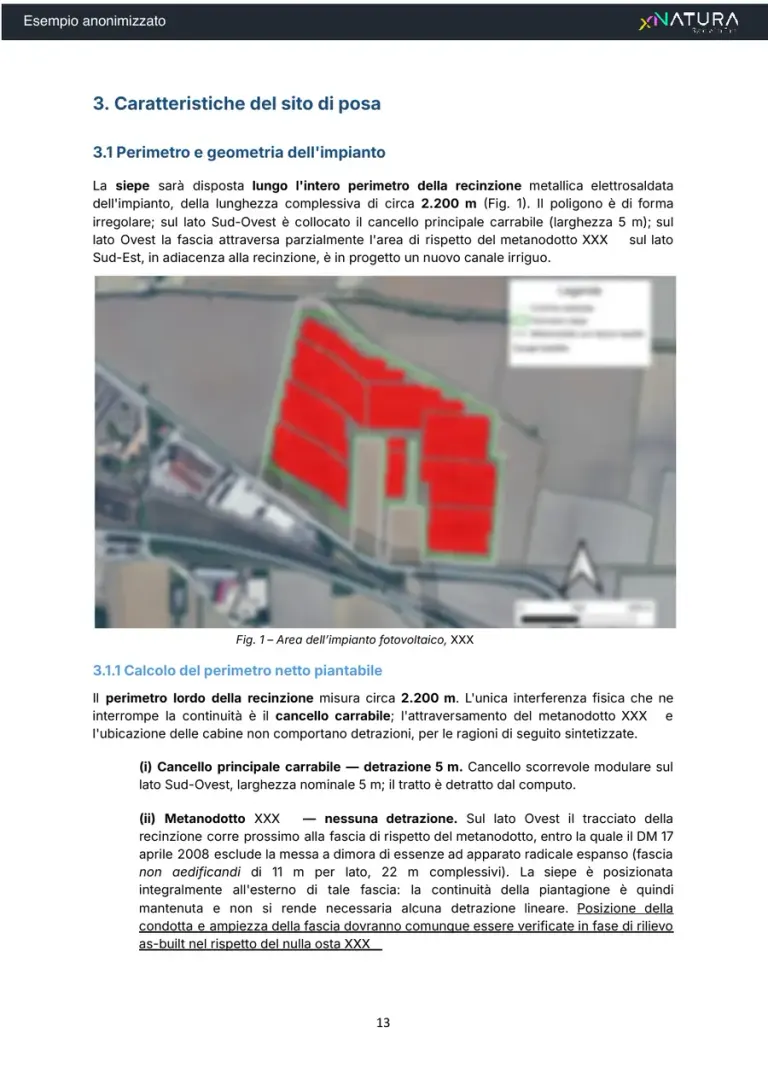
Ecological mitigation report for an appropriate assessment (VIncA)page 13 of 35 · PDF in ItalianDownload the report Alternatives04 / 15
Site alternatives
- Worked out by the expert on our data
What the authority asks for
A reasoned comparison of site and design alternatives, including the zero option.
How we produce it
We compare several sites on the same indicators. On this page, 27 sites of one company compared by ecological quality (MSA) and distance from protected areas. The reasoned choice stays with the expert.
Signed by Ecologist
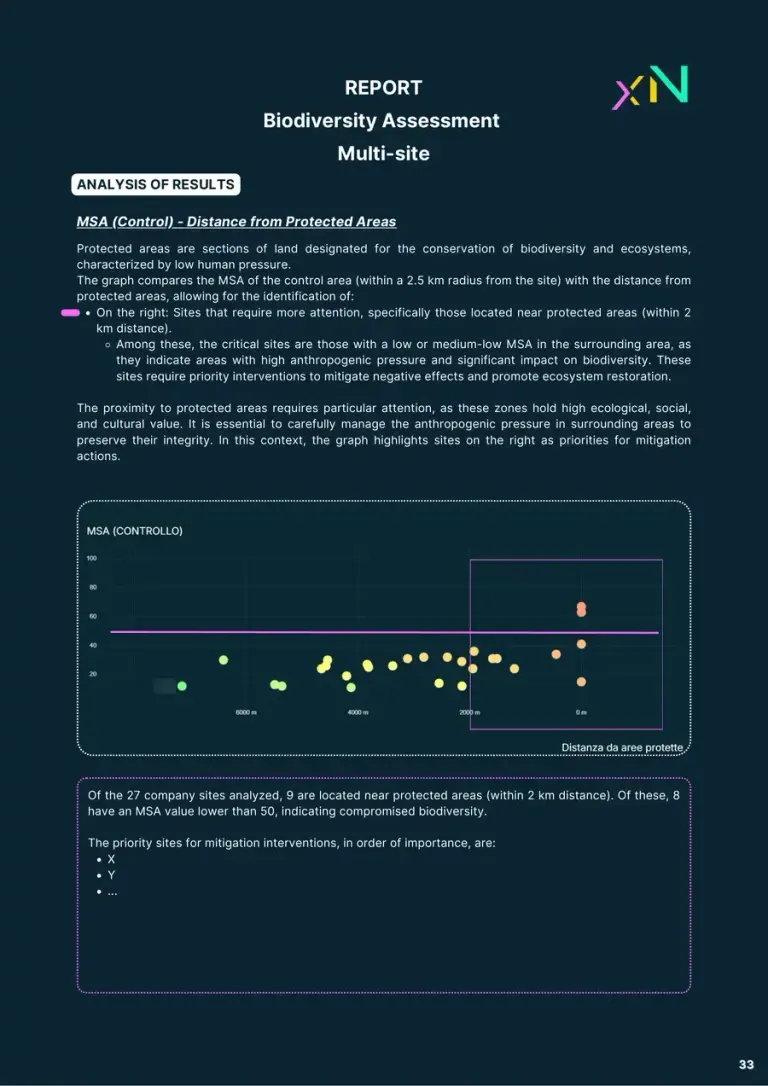
Multi-site biodiversity assessmentpage 5 of 8 · PDF in EnglishDownload the report Environmental framework05 / 15
Soil and land use
- Measured automatically
What the authority asks for
The state of the soil and the expected land take: current use, natural cover, sealing, organic carbon.
How we produce it
Land use and soil sealing on the site's perimeter, before and after the project, with the same legend and the same source on every map. Beside them, the MSA due to land use, on the site and in the control area.
Signed by Agronomist
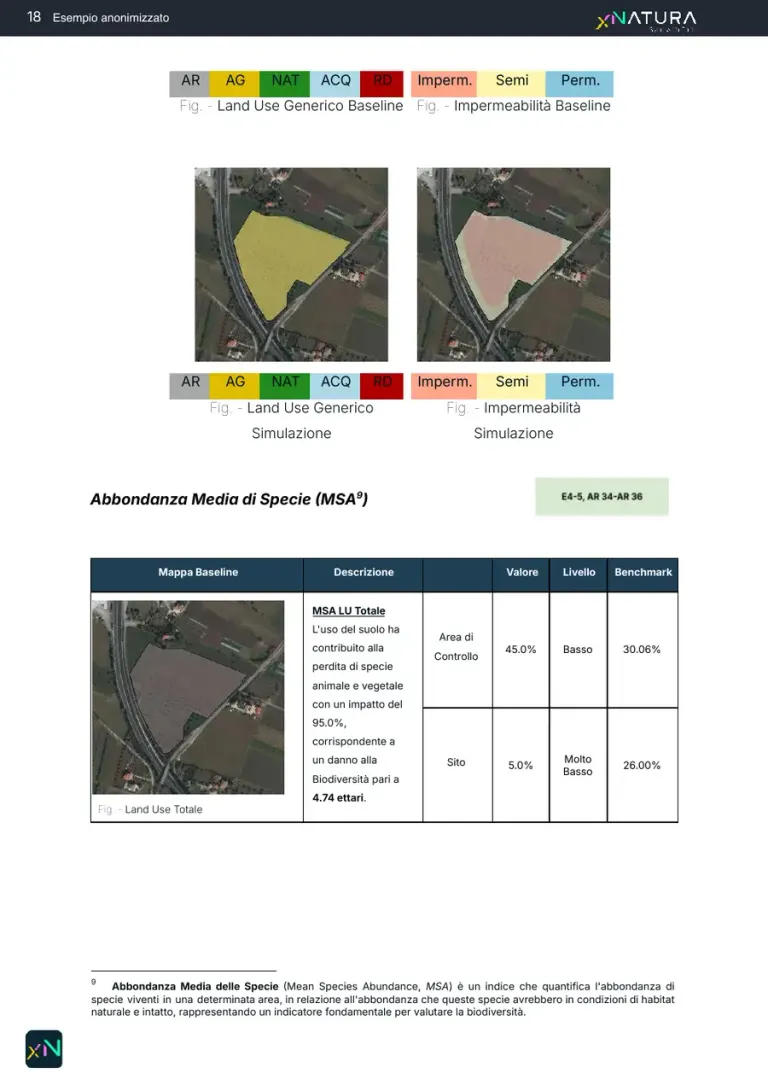
Pre- and post-construction simulation for an EIApage 19 of 40 · PDF in ItalianDownload the report Environmental framework06 / 15
Biodiversity
- Measured automatically
What the authority asks for
The habitats, flora and fauna of the area and their sensitivity to the project.
How we produce it
We measure MSA (Mean Species Abundance) and its components: land use for animals and plants, fragmentation and disturbance from infrastructure, on the site and in the control area, against the sector benchmark. The report also lists the IUCN Red List species and the pollinator indicators.
Signed by Ecologist
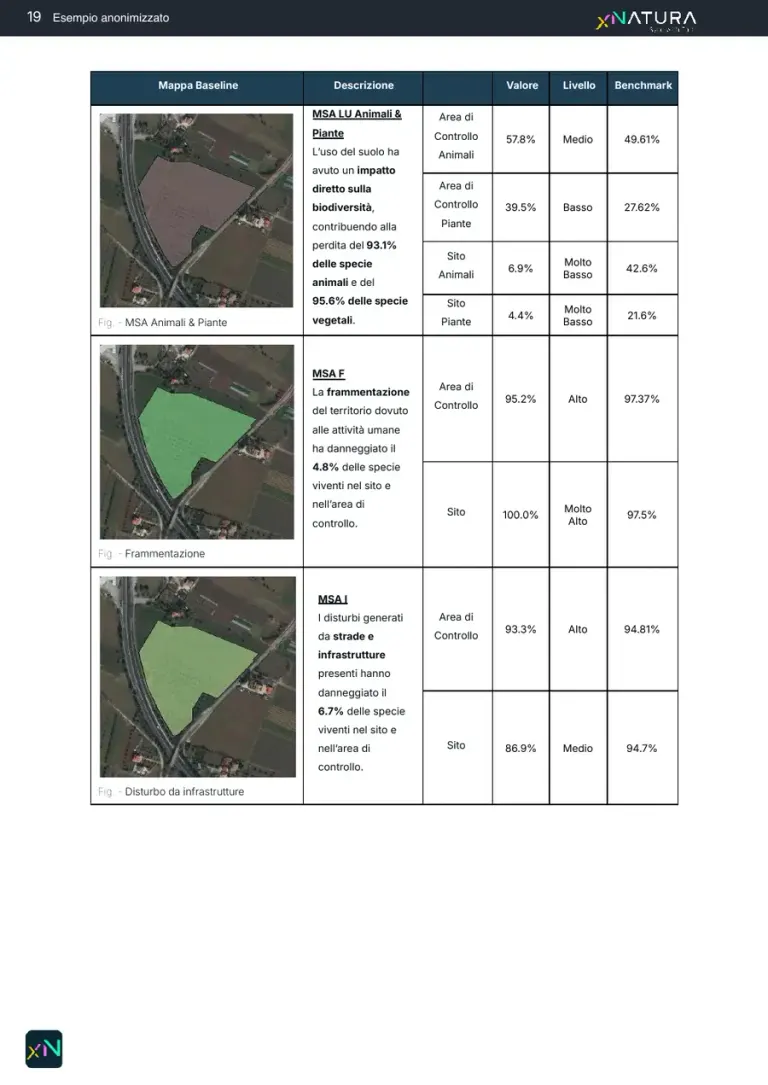
Pre- and post-construction simulation for an EIApage 20 of 40 · PDF in ItalianDownload the report Environmental framework07 / 15
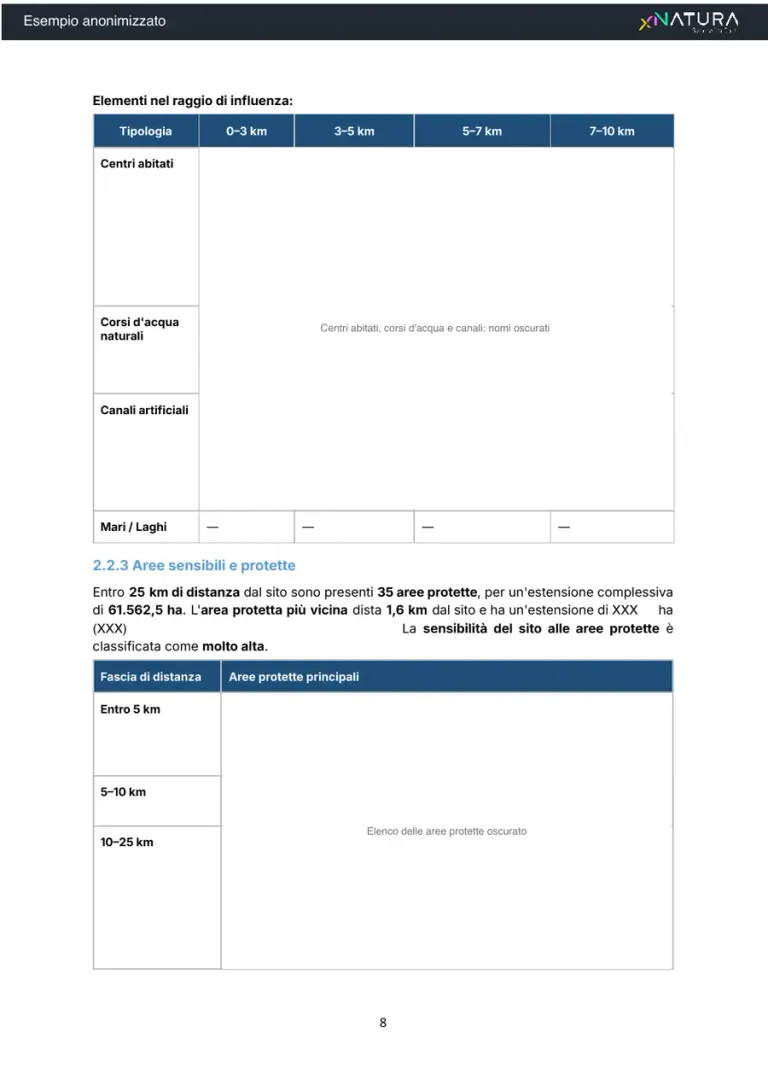
Protected areas and Natura 2000
- Measured automatically
What the authority asks for
The relation with Natura 2000 sites and other protected areas. It is the basis for deciding whether an appropriate assessment is needed.
How we produce it
We count the protected areas by distance band and find the nearest one: the figure comes out of the geographic calculation, not a manual search. In the published example the names are redacted.
Signed by Natura 2000 expert
Ecological mitigation report for an appropriate assessment (VIncA)page 8 of 35 · PDF in ItalianDownload the report Environmental framework08 / 15
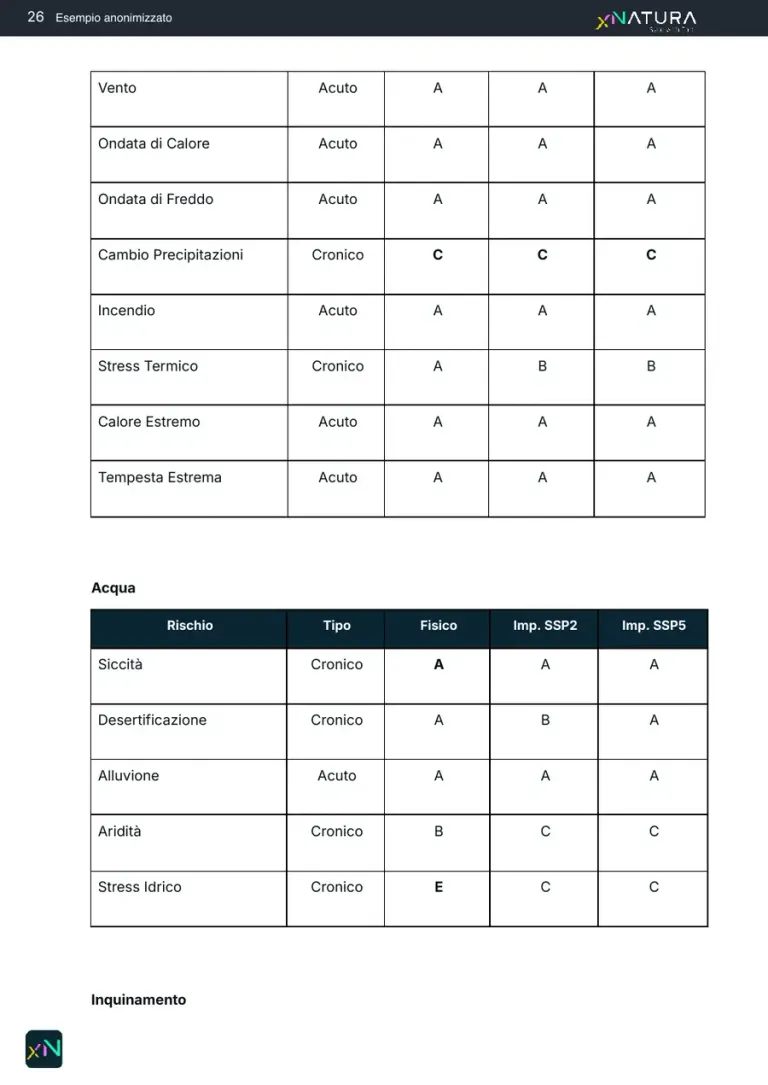
Water
- Measured automatically
What the authority asks for
Surface and ground water bodies and flood risk.
How we produce it
We assess the water-related risks (drought, desertification, flood, aridity, water stress) today and under the SSP2 and SSP5 climate scenarios. Water bodies and river basin plan constraints are checked and cited by the expert.
Signed by Climate and risk expert
Pre- and post-construction simulation for an EIApage 27 of 40 · PDF in ItalianDownload the report Environmental framework09 / 15
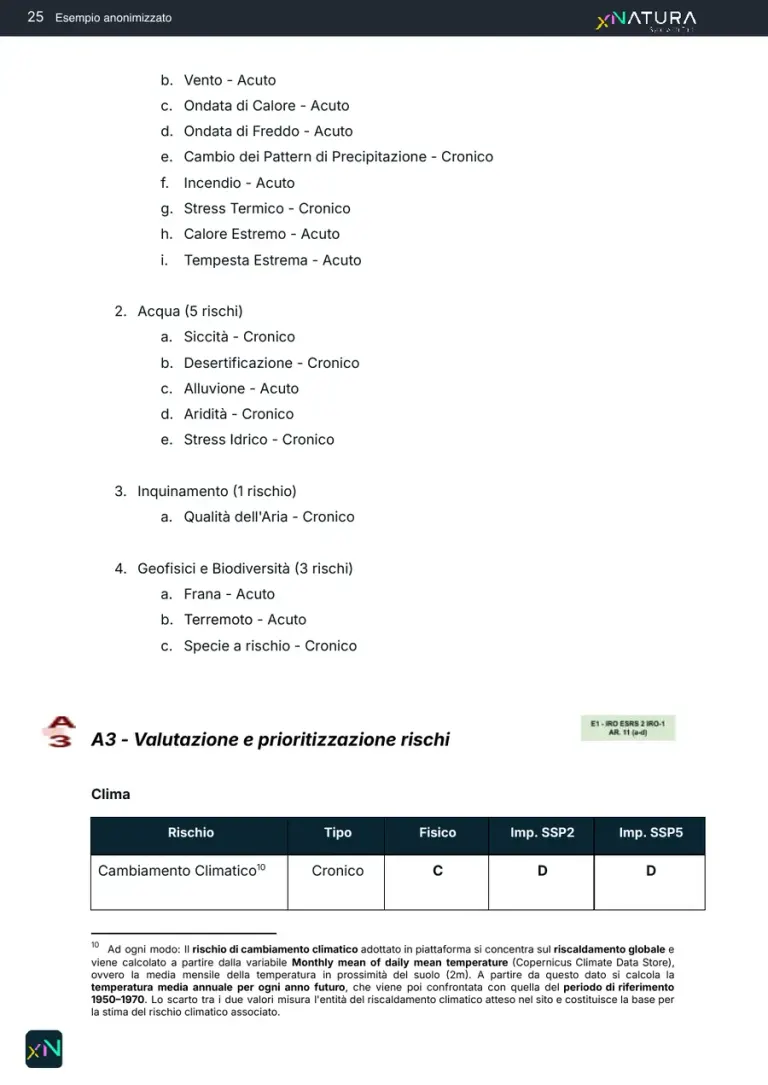
Climate and risks
- Measured automatically
What the authority asks for
The climate setting and the project's exposure to hazards: heat, drought, floods, landslides, wildfires, including in the coming decades.
How we produce it
The site's physical risks (climate, water, pollution, geophysical and biodiversity) rated from A (very low) to E (very high), today and under the IPCC SSP2 and SSP5 scenarios.
Signed by Climate and risk expert
Pre- and post-construction simulation for an EIApage 26 of 40 · PDF in ItalianDownload the report Environmental framework10 / 15
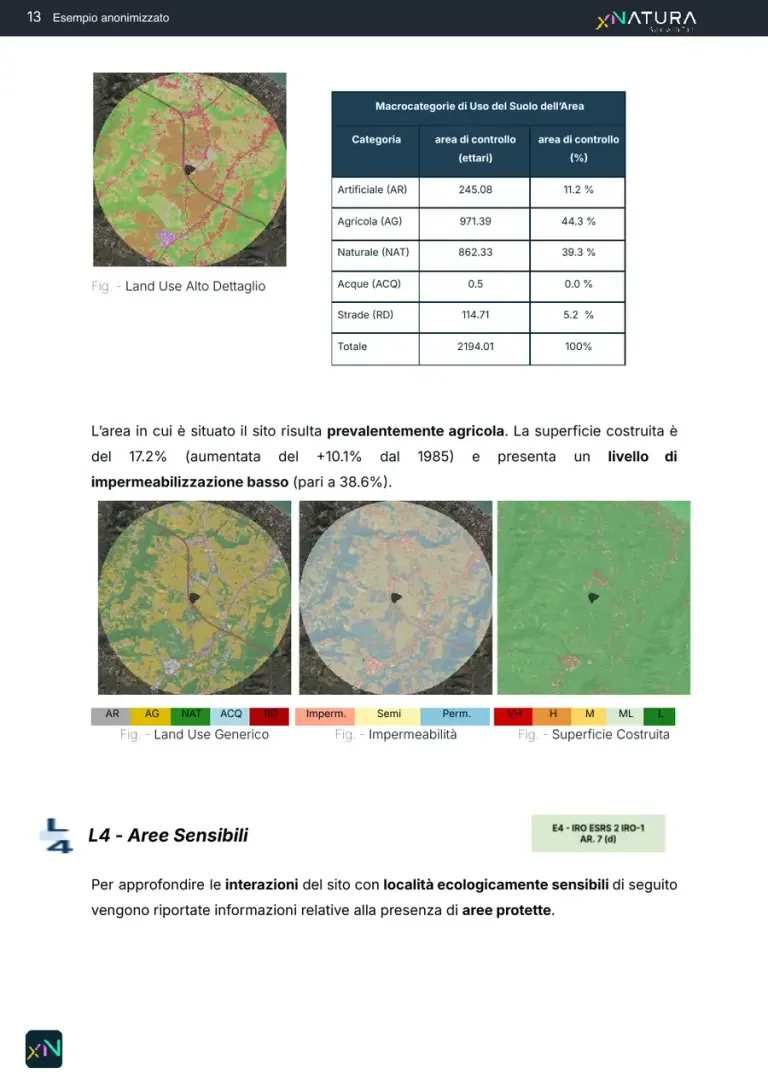
Landscape
- Worked out by the expert on our data
- With a specialist partner
What the authority asks for
The visual effect and the effect on the identity of the place: where the project can be seen from and how the view changes.
How we produce it
We provide the setting of the surroundings: high-detail land use, soil sealing and built-up surface, with its growth since 1985. Intervisibility and photomontages are done by a specialist partner: we do not have a visibility calculation of our own yet.
Signed by Expert and partner
Pre- and post-construction simulation for an EIApage 14 of 40 · PDF in ItalianDownload the report Environmental framework11 / 15
Noise and electromagnetic fields
- With a specialist partner
What the authority asks for
Noise levels during construction and operation, electromagnetic fields and buffer zones.
How we produce it
They need specialist acoustic and electromagnetic models, signed by licensed technicians. They are not XNatura data and we do not pretend to measure them.
Signed by Specialist partner
With a specialist partnerA specialist partner's chapter
The noise study and the electromagnetic field study are signed by licensed specialists. They are not XNatura data: we show no page of ours here because we do not have one.
No XNatura page: a partner's chapter
Impacts and measures12 / 15
Impact matrix
- Worked out by the expert on our data
What the authority asks for
For each component and each phase, the size of the impact on a reasoned scale.
How we produce it
For each indicator we compare the baseline with the scenario once the project is built and measure the difference: it is the numerical basis of the matrix. The classes and their reasons are assigned by the expert.
Signed by Ecologist
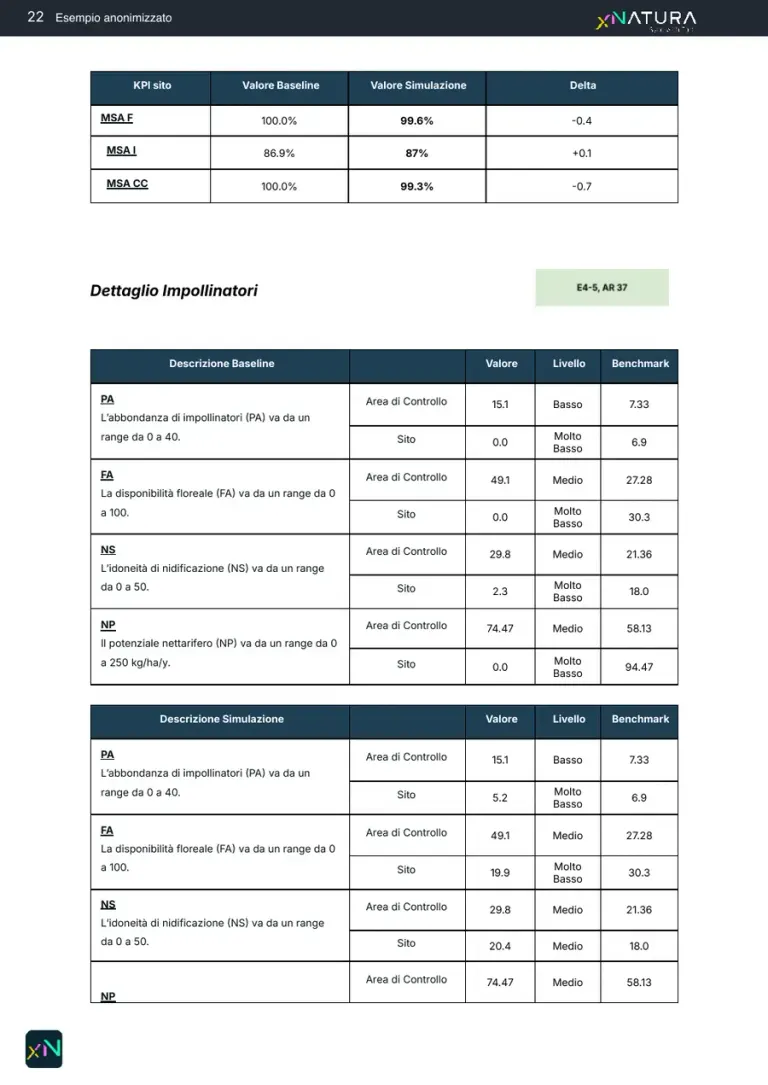
Pre- and post-construction simulation for an EIApage 23 of 40 · PDF in ItalianDownload the report Impacts and measures13 / 15
Mitigation and compensation
- Worked out by the expert on our data
What the authority asks for
Avoid first, then reduce, then compensate: concrete measures, with how their effect will be verified.
How we produce it
The expert proposes the measures and the platform simulates their effect on the same indicators. On this page: 150 nectar plants along the perimeter, 5 pollinator nest boxes and 5 information signs.
Signed by Ecologist
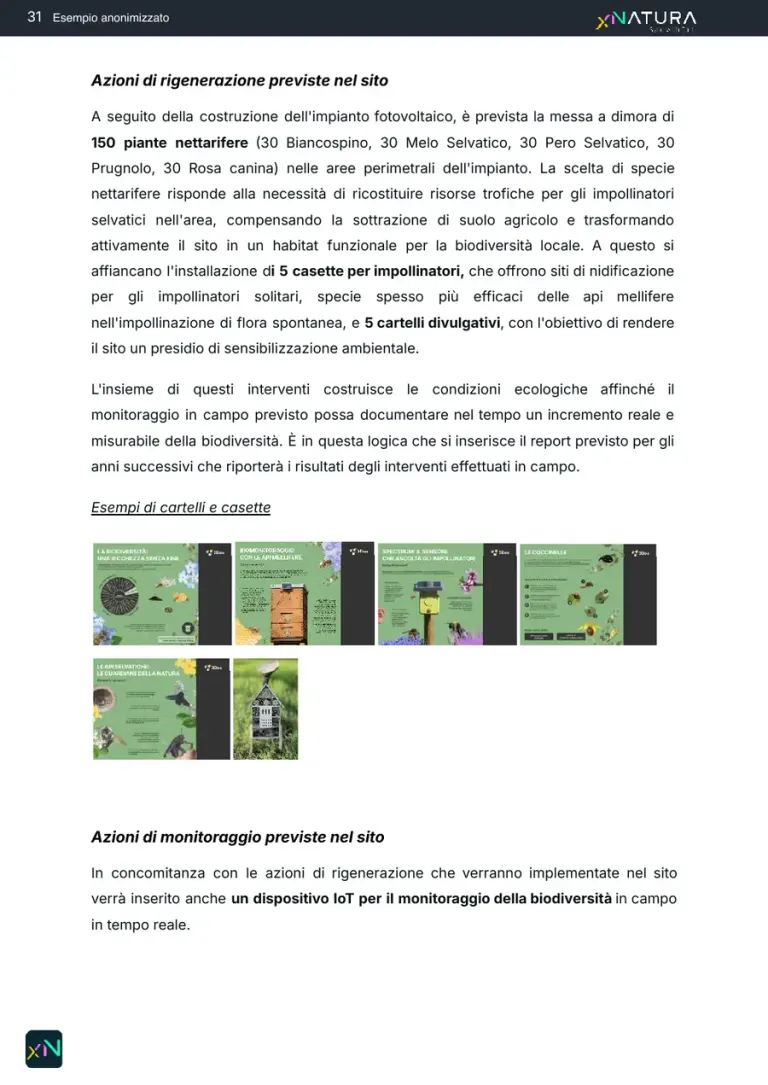
Pre- and post-construction simulation for an EIApage 32 of 40 · PDF in ItalianDownload the report Monitoring14 / 15
Environmental monitoring plan
- Measured automatically
- Worked out by the expert on our data
What the authority asks for
What is measured before, during and after the works, with which methods, where and how often.
How we produce it
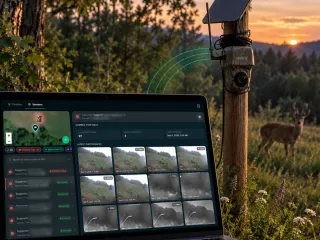
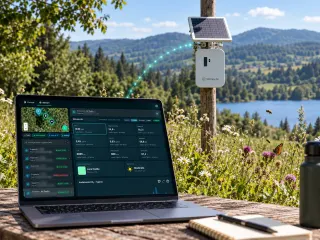
The plan is built on the baseline data and chooses the tools: on this page the comparison of Spectrum, Birdy and a camera trap for this site. Then sensors and Biodiversa surveys bring the evidence into the periodic reports.
Signed by Ecologist
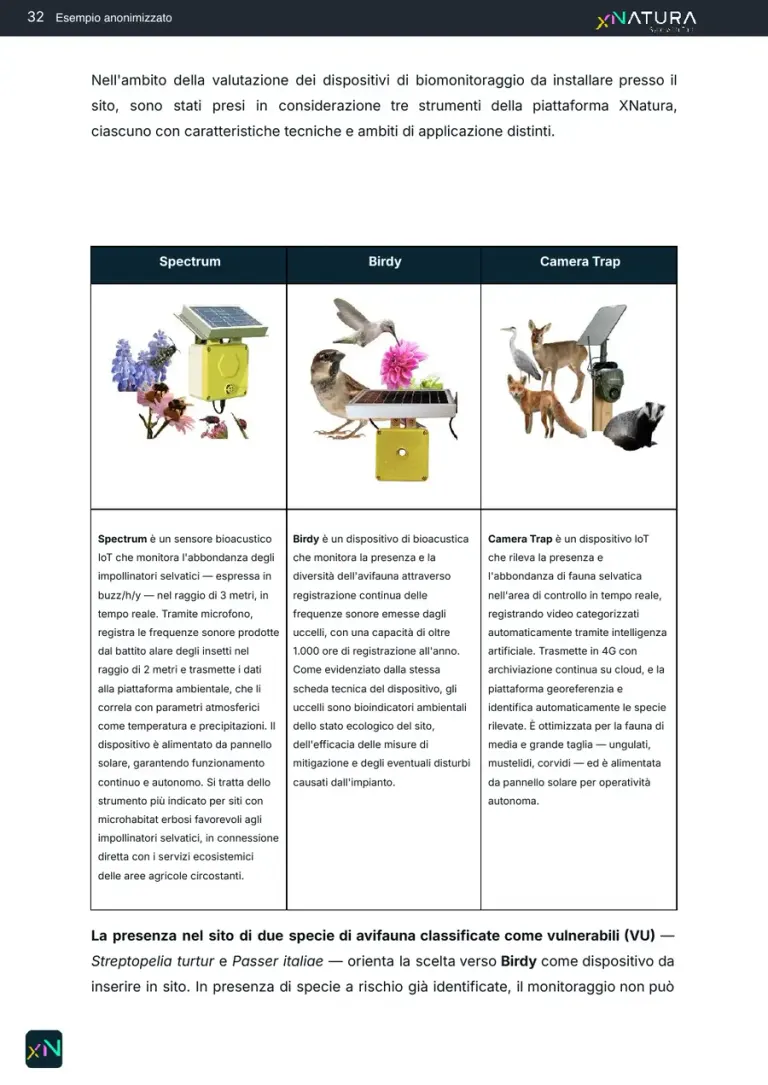
Pre- and post-construction simulation for an EIApage 33 of 40 · PDF in ItalianDownload the report Natura 200015 / 15
Appropriate Assessment (Natura 2000)
- Worked out by the expert on our data
What the authority asks for
Whether the project may affect a Natura 2000 site: screening and, if needed, an appropriate assessment of habitats and species.
How we produce it
We bring the data: nearby sites, habitats and species. The screening and the appropriate assessment are signed by a Natura 2000 expert. After the decree we answer the conditions one by one: on this page the first of five, the perimeter hedge of 11 native species with certified seed origin.
Signed by Natura 2000 expert
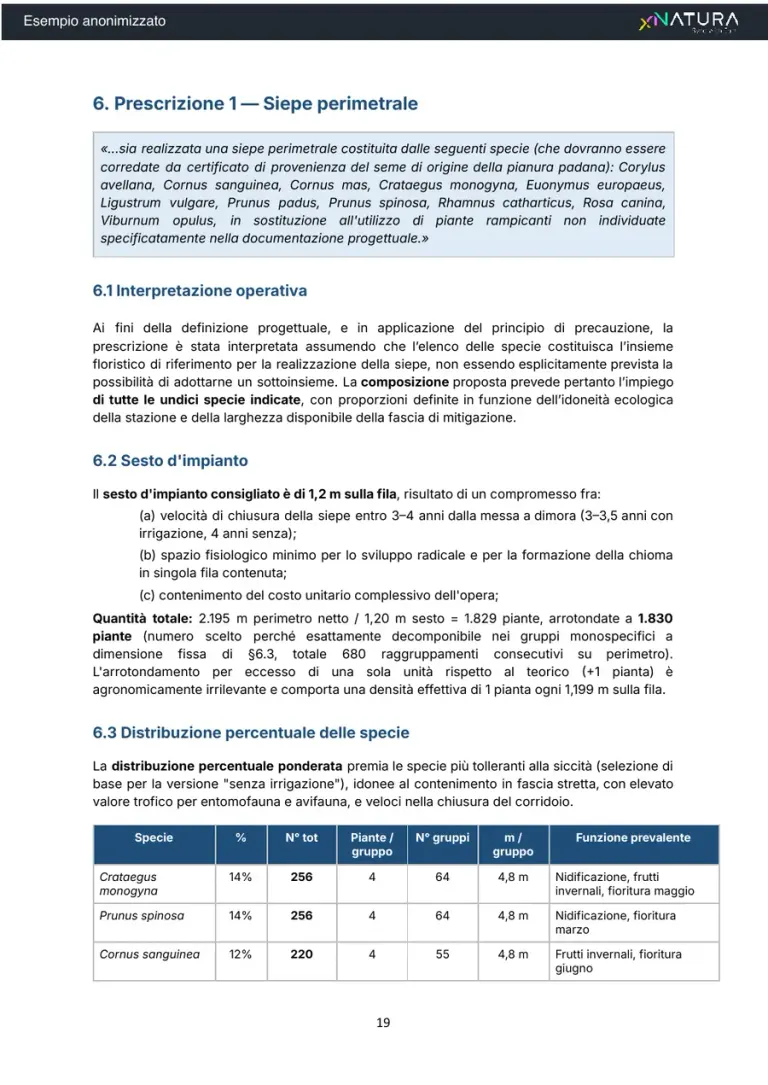
Ecological mitigation report for an appropriate assessment (VIncA)page 19 of 35 · PDF in ItalianDownload the report
How the maps are made
From satellite to a finished map with its legend.
Every map in the report is computed on the perimeter of your site, with its source, date and legend.
Satellites and datasets
Open imagery and data, updated over time.
XNatura models
Land use, MSA, pollinators, temperatures and risks, including under the IPCC climate scenarios.
200+ satellite layers
Refreshed every week and computed on the same perimeter of the site.
Finished map
Map, legend, scale and source laid out for the report, with the caption the authority expects.
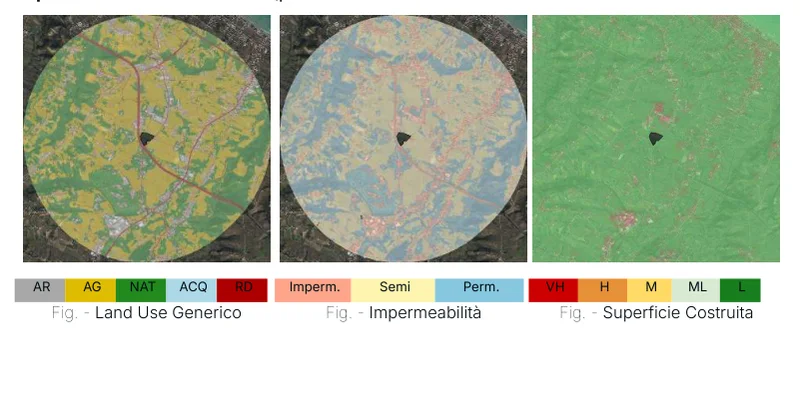
Same area, three layers
Switch the layer, the perimeter stays put.
The three figures come from the example EIA report. Same area, same scale: that is how land use, imperviousness and built-up surface can be compared without redrawing anything.

MSA (Mean Species Abundance) 
Land Use 
PA Relative Pollinator Abundance 
Hydrogeological Risk 
Aridity 
Extreme Events 
Natural Habitat Coverage 
Land Surface Temperature 
Protected Areas 
Built-Up Surface
Indicator cards of the XNatura platform, from the site's Satellite maps page. The platform's satellite maps
In the field with Biodiversa
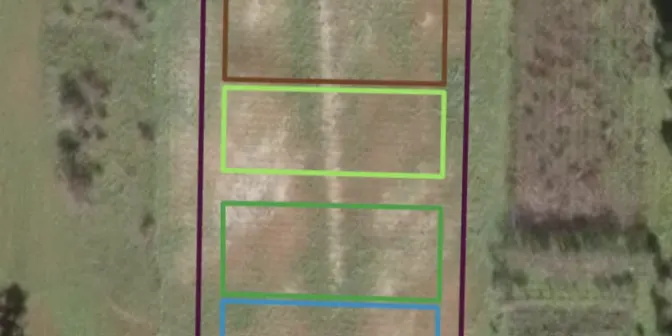
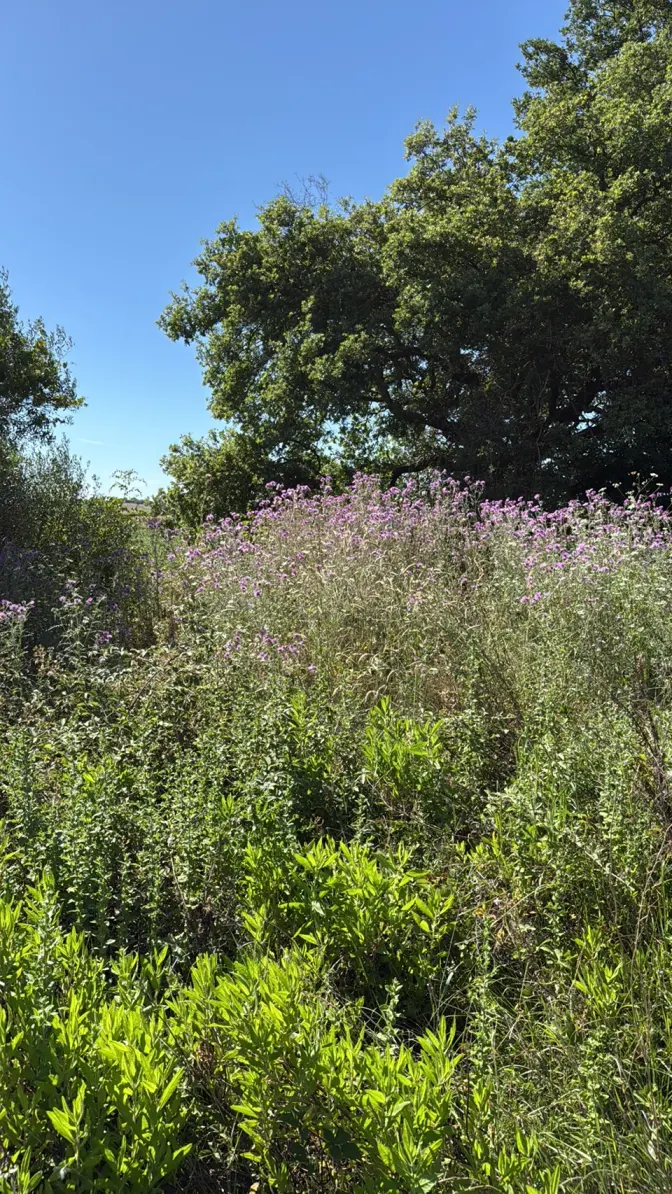
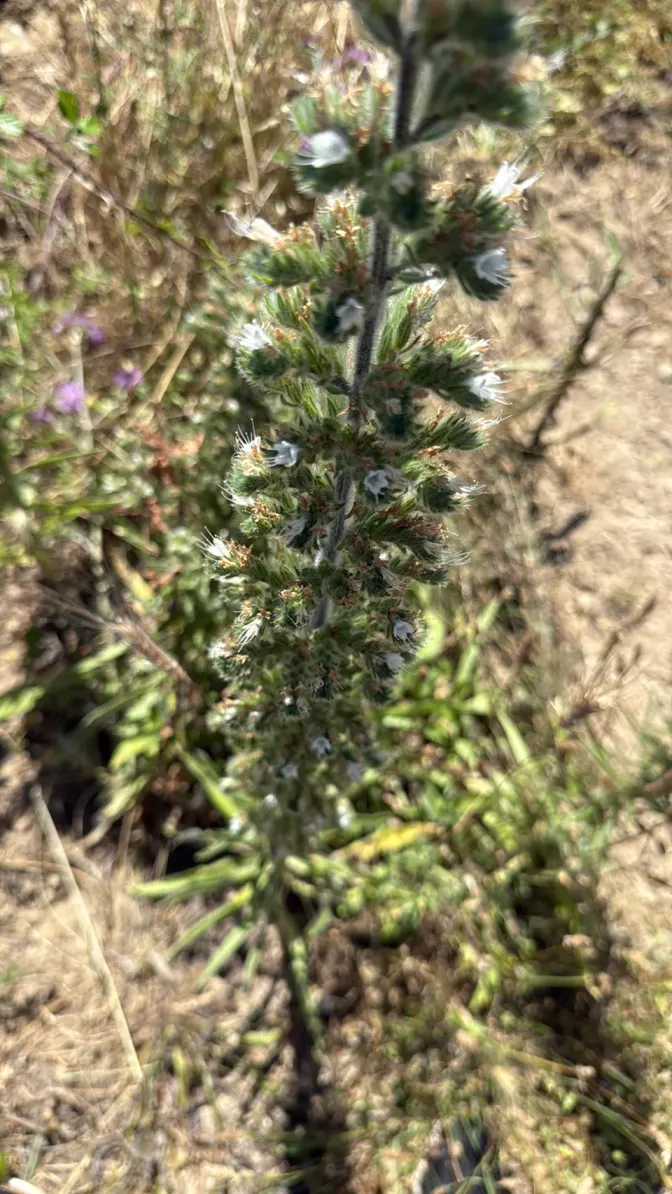
The satellite says where. The surveyor says what is there.
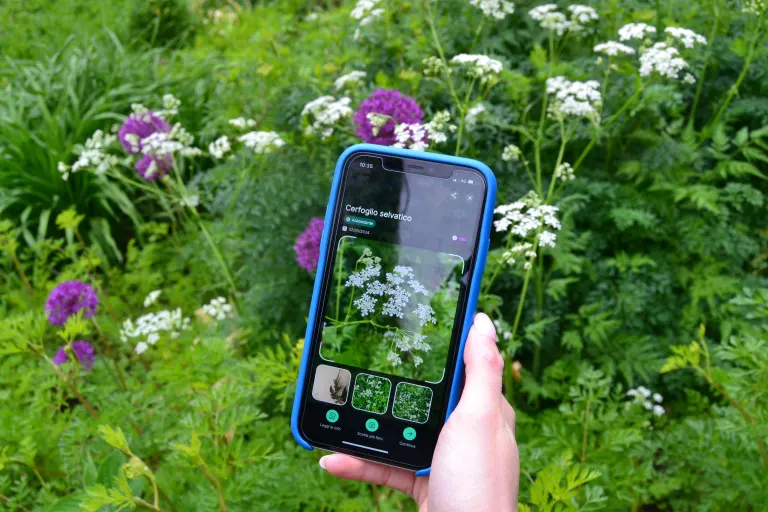
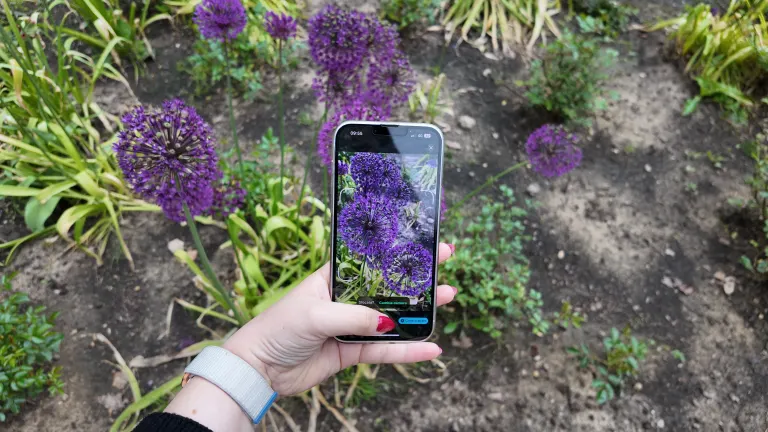
The Biodiversa app guides the surveyor in the field and sends every record, with its photo and position, straight into the report. No sheets to copy out, no photos without coordinates.
- FieldSurvey with the app
- CheckValidated by the expert
- DataCensus observations
- ReportThe record shows up in the report
The Nature Experts
The platform prepares the data. The expert signs.
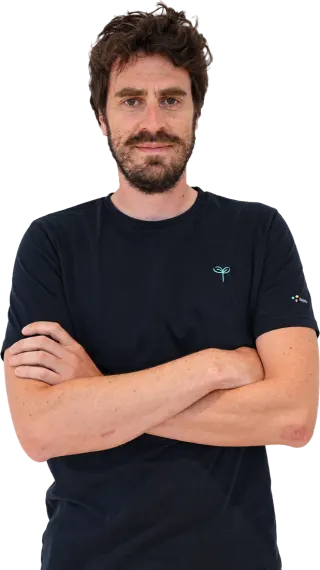
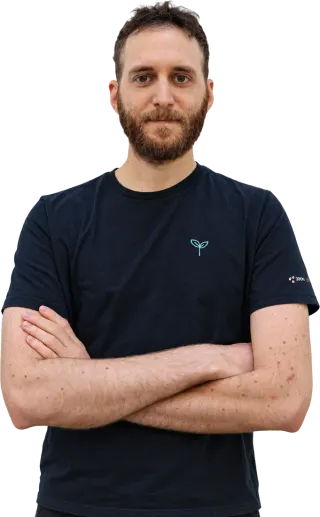
An environmental impact study is not an export of maps: someone has to interpret them, take responsibility for every judgement and answer to the authority. A named professional does.
- 01PrepareMaps, indicators and tables from the platform
- 02InterpretThe expert reads the data on the ground and assesses the impacts
- 03SignProfessional responsibility for the document
- 40+in-house nature, climate and ESG specialists
- 7disciplines under one roof
- UNI/PdR 179Italian biodiversity standard, project leader (2025)
Who works on a study
Ecologist
Reads habitats and communities, sets up the surveys, assesses the sensitivity of the site and signs the environmental framework.
Botanist
Flora and vegetation, protected species, pollinators and meadow strips, with verified identifications.
Zoologist
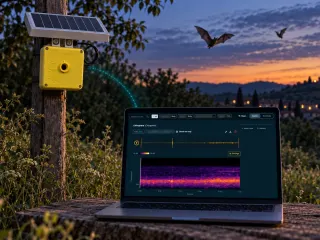
Birds, bats, amphibians and mammals: survey campaigns, bioacoustics, camera traps.
Natura 2000 expert
Screening and appropriate assessment of the habitats and species of the Directive annexes, site by site.
Study coordinator
The professional who coordinates the document, takes responsibility for it and signs it before the authority.
The team's disciplines
 Ecology & biodiversityBiologists, faunal zoologists, environmental engineers: baselines, surveys, camera traps, bioacoustics, telemetry.
 Assessment, reporting & complianceESRS E4, BNG, SBTN, GRI, EIA/SEA, VIncA, BREEAM/LEED. Board- and authority-ready.
 Agronomy & land useRegenerative agriculture, supply chains, land and vegetation management.
 Data & remote sensingGIS, satellite analysis, IoT data, predictive models, digital twinning.
 Climate & riskIPCC scenarios, physical risk, wildfire and water modelling per asset.
 Strategy & deliveryNature strategy, action plans, green finance, stakeholder engagement, client training.

After the decree: monitoring
The conditions are the beginning, not the end.
71 EIAs in 100 end with conditions. The monitoring plan turns them into repeatable measurements, year after year, with evidence ready for the authority.
Pre-construction
What is measured
- Baseline of flora, birds and pollinators
- Starting land use and natural cover
- Zero point of temperature and hydrology
With which tools
- Biodiversa surveys on transects and pins
- Birdy and Spectrum installed for the season
- Reference satellite maps
What you hand to the authority
- Signed baseline report
- Maps with legend and date
- Protocol and position of the points
Change
What is measured
- Land use with the plant and with the mitigation, in hectares and percent
- Change in MSA and pollinators against pre-construction
- Comparison with the control area
With which tools
- Project layout and plan uploaded to the site (the developer's KML)
- Simulation in three states: no plant, plant, plant with mitigation
- Land use and sealing maps before and after
What you hand to the authority
- Simulation report: baseline, simulation and change of every indicator
- Mitigation sized on the change, with species and areas
- The numeric basis for the impact matrix and the monitoring plan
Construction phase
What is measured
- Disturbance to birds in the breeding season
- Changes in cover and bare soil
- Air quality on the construction site
With which tools
- Birdy for birdsong, continuously
- Sintropy Air air sensors
- Camera traps on wildlife corridors
What you hand to the authority
- Periodic reports on the thresholds met
- Prompt notice of any deviation
- Log of corrective actions
Post-construction
What is measured
- Recovery of vegetation and meadow strips
- Pollinators and birds against the baseline
- Effectiveness of mitigation and compensation
With which tools
- Spectrum for pollinators
- Birdy and camera traps, continuously
- Maps refreshed every week
What you hand to the authority
- Annual report with year-on-year comparisons
- Evidence for each condition
- Data available on the platform
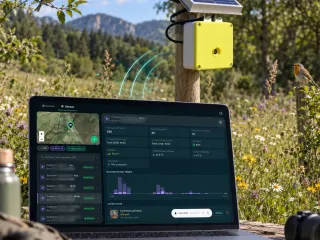
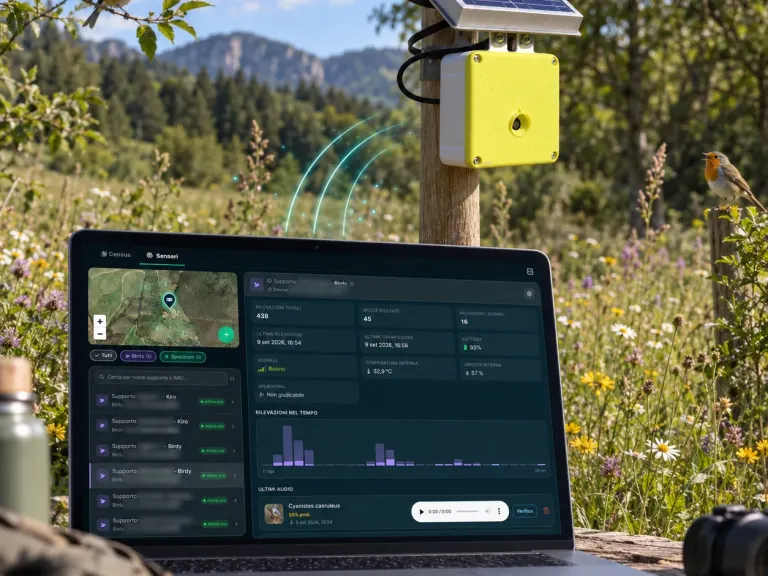 BirdyListens to nature: birds recognised by their song.
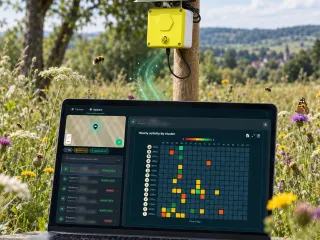
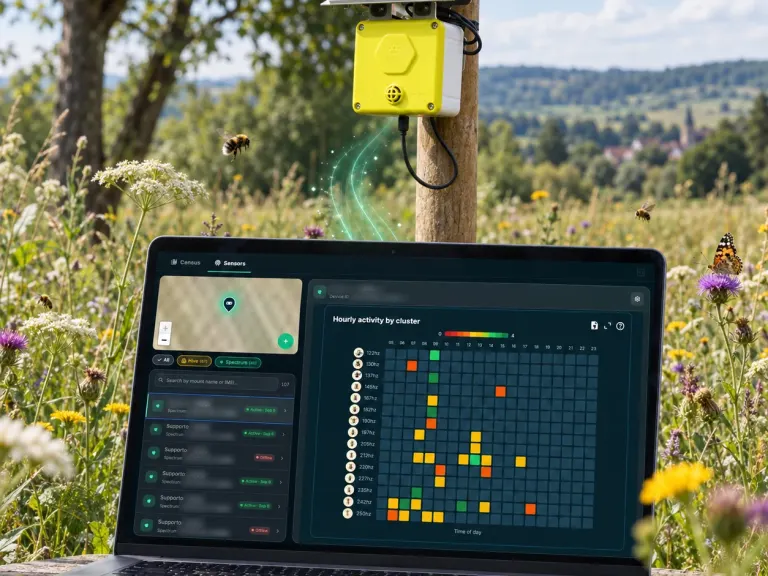 SpectrumCounts pollinators in the field, day by day.
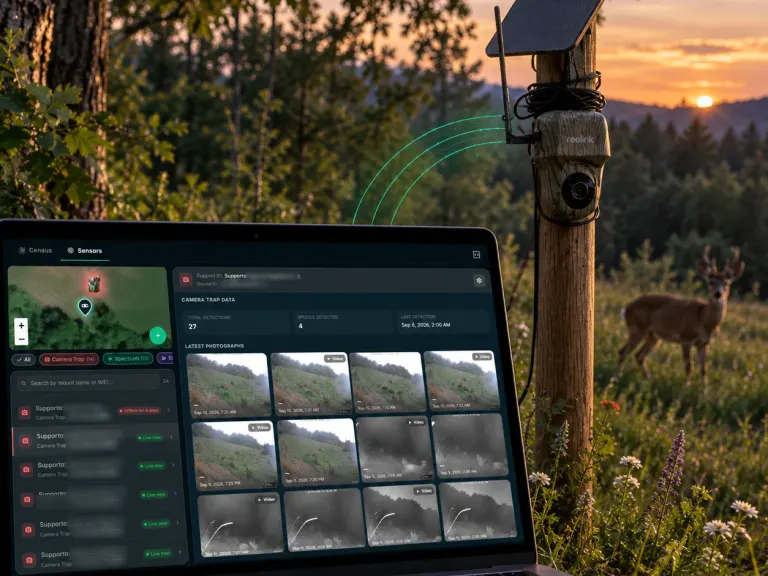 Camera trapsWatch wildlife along corridors and fences.
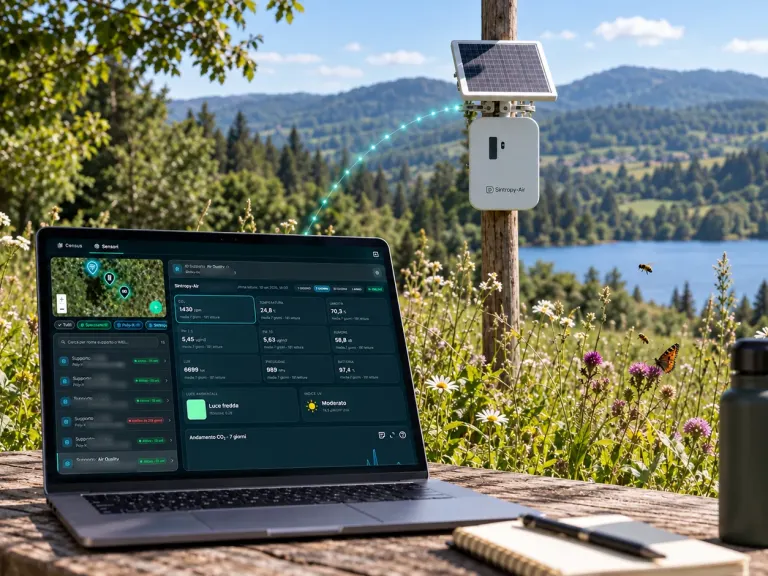 Air sensorsPrecision air quality, on construction sites too.
Maps refreshed every week
200+ satellite layers refreshed every week: the evidence for the authority is always the latest, not last year's.
Monitoring already public on the site
 TransportationBrebemi
 TransportationCAV
 TransportationGruppo Save
 EnergyCubico
 EnergyRWE
 EnergyEdison Next
- 200+projects
- 12countries on 4 continents
- 10,000+IoT sensors in the field
- 200+satellite layers refreshed every week
Case studies already public on the site. They are field monitoring projects, not outcomes of EIA procedures.Transportation casesEnergy casesThe field sensors
Example reports
See what you receive: real reports, anonymised
Deliverables our experts signed for real clients, with names, places and coordinates removed. Pick one, leave your details and download the PDF straight away.
Your report is ready.
Open it now; a strategist may follow up if it fits a project of yours.
Download the PDF ↓Our systems are temporarily unreachable and the request did not go through. Try again, or write to info@3bee.com.
The voice that guides you through the report
Ask, and the page takes you there.
A voice assistant always within reach, bottom right. Ask it about a section of the report, a figure or who signs what: it answers and brings the page to the right point.
- It answers about this page: how long an EIA takes, the coverage labels, how we produce each section.
- It walks you through the document: it scrolls to the section and highlights it while you keep talking.
- If you want a first analysis of your site on the platform, it prepares it, and you open it on XNatura after signing in.
You can ask, for example
- Take me to the Appropriate Assessment
- How long does a screening take?
- What does the chapter on noise and electromagnetic fields cover?
- Who signs the study?
- I'd like a first analysis of my site on the platform
Contact
An EIA or a screening to prepare?
Tell us about the project, the stage and the deadline. A named strategist replies within 24 working hours.
The example reportsReal reports, anonymised: the simulation of a site for an EIA and the answer to the conditions of an appropriate assessment.Choose and download30 minutes with the XNatura team
Video call on Google Meet
Would you rather talk it through?
Either way you are speaking with an AI assistant, and the conversation is transcribed. How we handle your data
Tell us about your project
Request sent.
One of our strategists replies within 24 working hours. If you need us sooner, write to info@3bee.com.
Our systems are temporarily unreachable and the request did not go through. Try again, or write to info@3bee.com.
FAQ
Frequently asked questions on the EIA
How long does a state EIA take in Italy?
In the catalogue of the MASE Environmental Assessments portal, the median concluded EIA takes 982 days under the PNIEC-PNRR regime, about 2.7 years, and 1,087 days under the ordinary regime. Only procedures concluded with a start and a decision date are counted: those still open, often the longest, are not.
How many EIAs end with a negative opinion?
Of the 619 EIAs concluded with a known outcome, 21 in 100 were negative, 71 in 100 positive with conditions and 8 in 100 positive without conditions. Measured on 6 October 2026.
How long does an EIA screening take?
The median is 287 days under the ordinary regime and 249 days under the PNIEC-PNRR regime. Of the screenings concluded with a known outcome, 62 in 100 exclude the project from the EIA and 15 in 100 refer it to an EIA.
What do you prepare for an environmental impact study?
The environmental parts of the study: the baseline of the site measured from satellite and in the field (land use, biodiversity, protected areas and nearby Natura 2000 sites, water, climate and risks), the impact assessment, the mitigation and compensation measures and the monitoring plan. Every document is signed by an expert of the team.
Do you also handle the Appropriate Assessment (Natura 2000)?
Yes: we analyse the habitats and species of the Natura 2000 sites near the project and prepare the mitigation measures. Among the example reports you can download is the technical answer to the five conditions of an appropriate assessment for a solar plant.
Where do the numbers on this page come from?
From the "Projects and authorisations" catalogue that XNatura builds on the MASE Environmental Assessments portal and updates every day. Durations and outcomes are measured on concluded procedures, and no statistic is shown for a group of fewer than 10 procedures.
XNatura · AI
Voice assistant
Ask me about a section of the report, a figure from the MASE catalogue or who signs what: I'll take you where you need to be.
You can ask, for example
- Take me to the Appropriate Assessment
- How long does a screening take?
- What does the chapter on noise and electromagnetic fields cover?
- Who signs the study?
- I'd like a first analysis of my site on the platform
You’ll speak with XNatura’s AI assistant. Your microphone only starts with your permission. You can review and confirm your details before sending a request. If the assistant prepares a demo for you, the site’s name and location go to the XNatura platform, which keeps them for one hour so you can open it. How we use your data
Getting your conversation ready…
The conversation
Start with a question or tell us what you need.
Your project updates as you speak
Review and send your request