




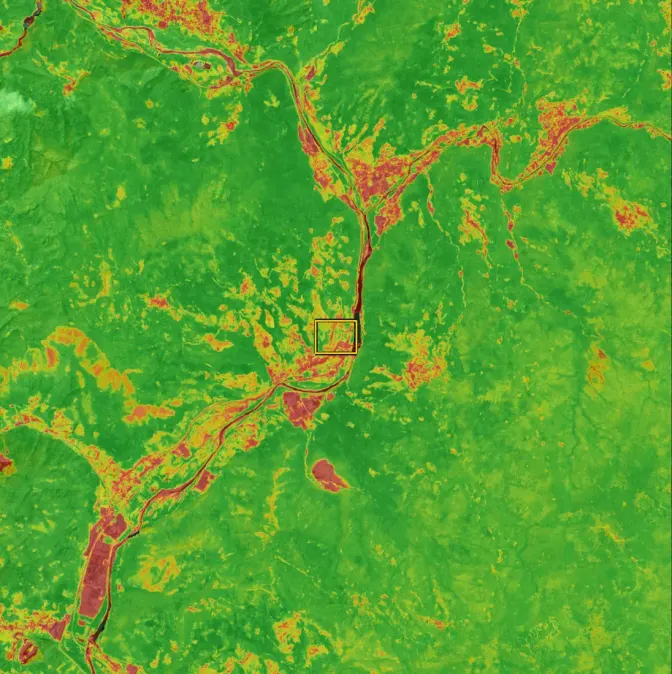

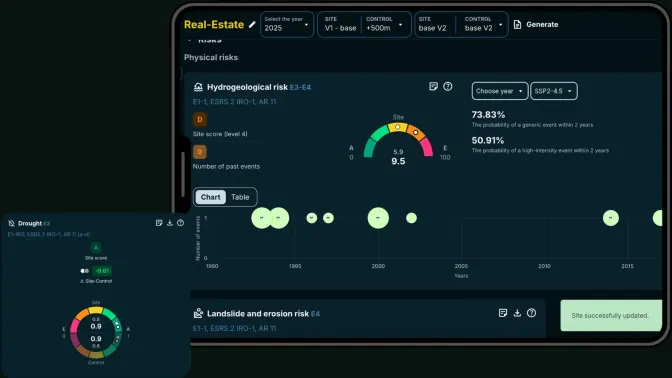

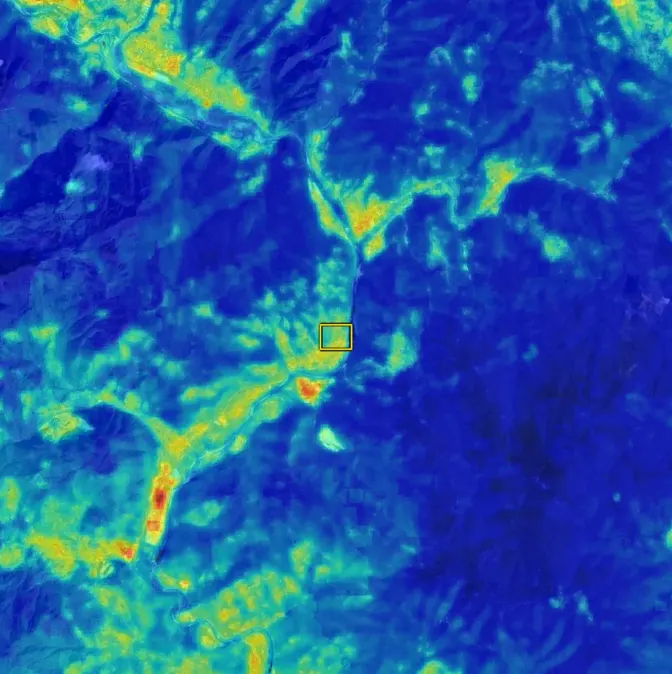

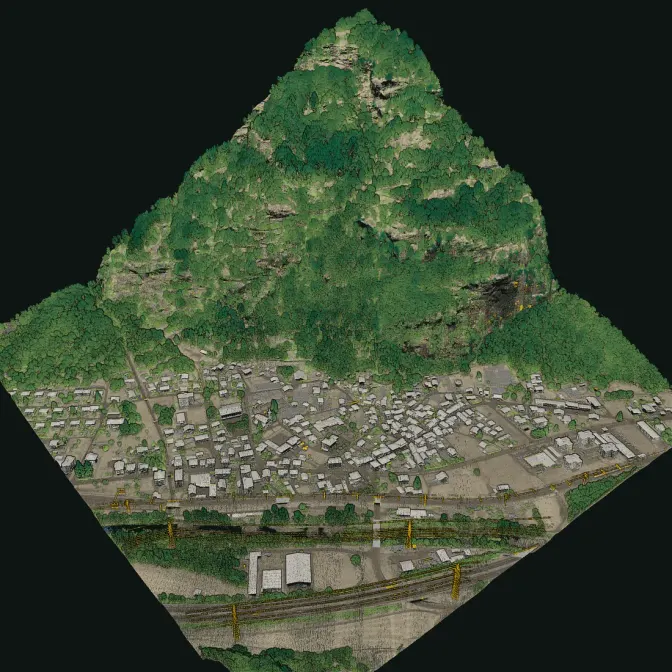
 MASE projects
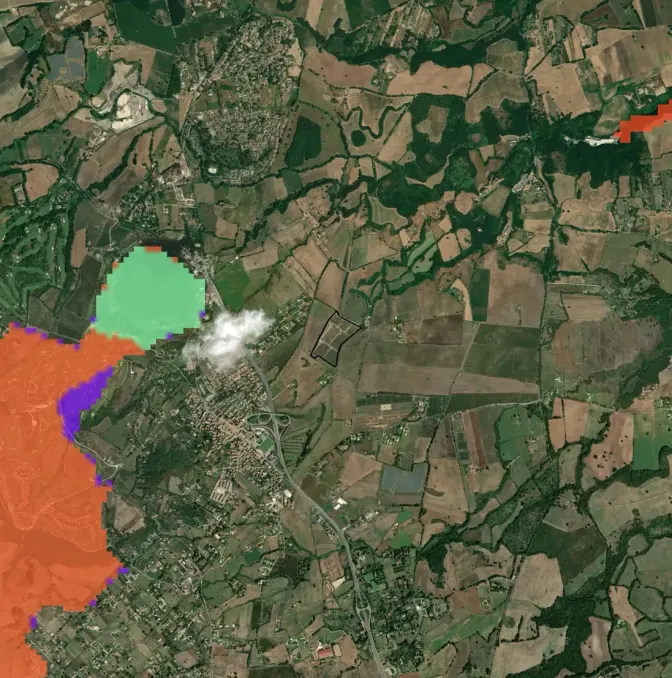
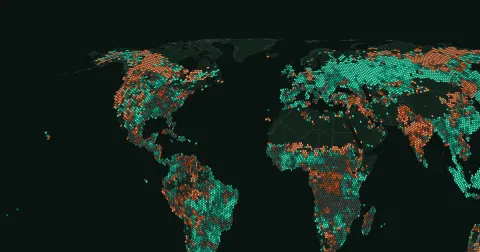 Wildfires worldwide
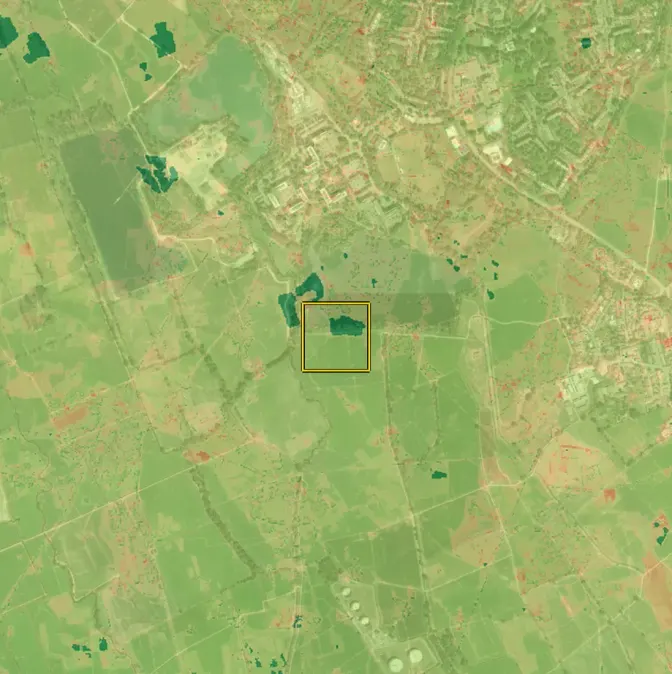
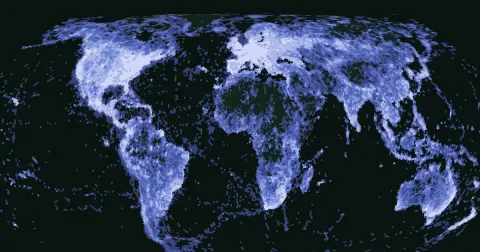 Species worldwide
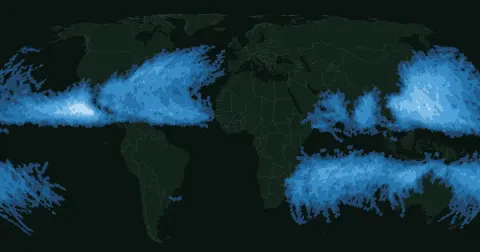 Tropical cyclones
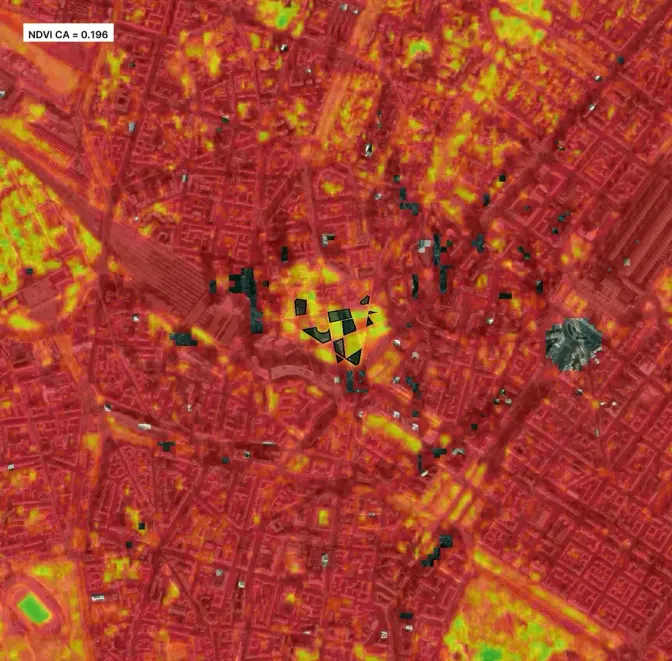
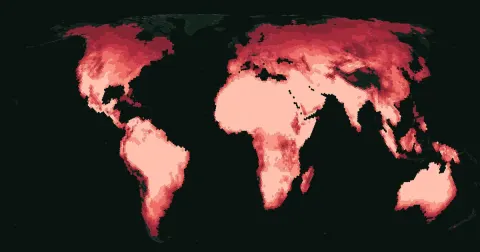 Extreme heat



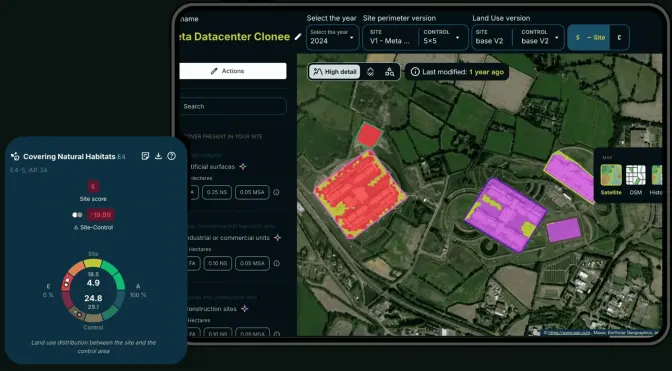
Live data · Real estate
A site's nature, measured live.
Birds, pollinators and mammals detected by sensors. Satellite maps around the boundary. Reports ready for certifications. Below is a real site with today's data: it is what you can show to the tenants and investors of your property.
Data as of November 14, 2026 at 4:54 PMOasi 2.0 di Gaminaraprovince of Pavia · 5.4 hectares34 sensors in the field
Birds
since March 2026- speciesHow it is calculatedBird species with at least 20 detections, model confidence of 50% or more, geographically implausible species left out. Without the 20-detection threshold there would be 194, with many false positives.Source: Oasi 2.0 di Gaminara, XNatura platform data as of November 14, 2026
- 106
- detections
- 67,137
Most heard
- Eurasian blackcapSylvia atricapilla11,004detections
- Common blackbirdTurdus merula10,423detections
- European robinErithacus rubecula7,598detections
- Cirl buntingEmberiza cirlus5,201detections
Pollinators
2026 season- buzzes per hourHow it is calculatedPollinator buzzes recognised, divided by the hours the Spectrum sensors listened, over the whole season.Source: Oasi 2.0 di Gaminara, XNatura platform data as of November 14, 2026
- 12.4
- buzzes detected
- 41,830
Variety: 19 of 19 frequency notesHow it is calculatedSpectrum groups buzzes by wingbeat frequency, in 19 notes from 115 to 250 Hz. The more different notes appear, the more groups of pollinators visit the site.Source: Oasi 2.0 di Gaminara, XNatura platform data as of November 14, 2026
In the last 30 days: 1,129 buzzes in 386 hours of listening (2.9 per hour). The chart keeps the whole season, also when activity drops.
Mammals
2026- wild speciesHow it is calculatedWild species with at least 8 passages recognised by the camera traps since the start of the year. Domestic animals and isolated recognitions are not counted.Source: Oasi 2.0 di Gaminara, XNatura platform data as of November 14, 2026
- 6
- passages
- 383
Latest passages
Who passed by
All passages, further downData that serveBREEAMLEEDGRESBTNFDESRS E4
Maps
Where it happens.
Every reading comes from a precise site, and what lies around it decides what the sensors hear. These are the maps a property manager needs.
BirdySpectrumCamera trapsSite boundary
Natural, agricultural, artificial
How much nature lies around the boundary. It is the starting point of every ecological assessment of a site: it decides which species can arrive.
- Within 2.5 km
- 74.7 % natural
- Agricultural 23.2% · artificial 2.1%
- Inside the site
- 29.7 % natural
- Agricultural 70.3% · artificial 0.0%
Artificial · 55 haAgriculture · 614 haNatural · 1,979 ha
XNatura land use classification, site and surroundings.
Land cover
The land use classes, from woodland to built-up. Habitats, ecological value and certification credits are calculated from here.
- Estimated trees on the site
- 182 per hectare
- In the surroundings: 374 per hectare
- Greenness (NDVI) of the site
- 0.57
- In the surroundings: 0.51
Forests · 450 haBroad-leaved forest · 442 haQuercus pubescens · 375 haQuercus petraea · 287 haComplex cultivation patterns · 187 haOstrya carpinifolia (1) | Fraxinus ornus (1) · 180 haTriticum aestivum · 157 haRobinia pseudoacacia · 132 ha
The eight largest classes in the surroundings of the site.
Land surface temperature, by day
Where the ground heats up most in summer. It tells where to put shade, trees and light surfaces.
- Mean on the site
- 35.9 °C
- Band B · low
- Mean in the surroundings
- 34.9 °C
- Band A · very low
Image of July 31, 2026 · 8 dates available on the platform.
Land surface temperature, by night
The heat that remains after sunset: the one that weighs on the comfort of those who live and work in the building.
- Mean on the site
- 21.3 °C
- Band B · low
- Mean in the surroundings
- 21.4 °C
- Band B · low
Image of July 21, 2026 · 27 dates available on the platform.
Heat island
How much warmer each point is than the average of the area (UTFVI index). Above zero the point is warmer than its surroundings.
- Mean on the site
- 0.17
- Band A · very low
- Mean in the surroundings
- 0.26
- Band B · low
Image of July 21, 2026 · 27 dates available on the platform.
Greenness
The vigour of the vegetation (NDVI), month by month: it shows whether the site's green really works.
- Mean on the site
- 0.54
- Band B · high
- Mean in the surroundings
- 0.71
- Band B · high
Image of June 30, 2026 · 5 dates available on the platform.
Light at night
Artificial light at night disturbs bats, insects and migrating birds. Reducing it is a measure that needs no works.
- Mean on the site
- 1.17 nW/cm²/sr
- Band A · very low
- Mean in the surroundings
- 1.24 nW/cm²/sr
- Band A · very low
Image of January 31, 2026 · 6 dates available on the platform.
Nitrogen dioxide
An indicator of traffic and combustion around the site.
- Mean on the site
- 38.6 µmol/m²
- Mean in the surroundings
- 38.4 µmol/m²
Image of June 30, 2026 · 5 dates available on the platform.
Satellite
The true-colour image of the site, updated every month.
Image of June 30, 2026 · 13 dates available on the platform.
Birdy · bioacoustics
Birds.
Birdy sensors listen to the site and recognise species by their song. Each detection is a five-second clip you can play again. Pick a species to hear it and to see at what time it sings.
- Sylvia atricapilla11,004detections
- Turdus merula10,423detections
- Erithacus rubecula7,598detections
- Emberiza cirlus5,201detections
- Emberiza calandra2,728detections
- Sturnus vulgaris2,661detections
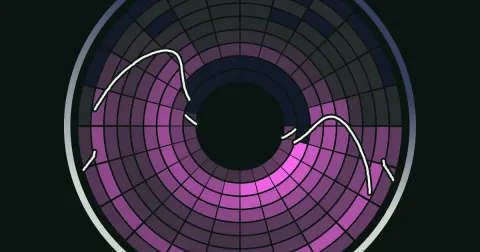
The dawn chorusHow it is calculatedEach cell is an hour of the day in a month: the brighter, the more detections. Hours run around the dial (midnight at the top, the site's local time), months go from the centre to the rim. The two light lines are the real sunrise and sunset, day by day. The dashed cell is now. The count also depends on the hours the sensors listen.Source: Oasi 2.0 di Gaminara, XNatura platform data as of November 14, 2026
Hours around · months from the centre (March) to the rim (November) · all species
fewer songsmore songs
In May, the richest month, half of the songs fall between 7:00 and 12:53.
In numbers
- effective speciesHow it is calculatedThe number of equally frequent species that would give the same diversity: the exponential of the Shannon index the platform computes on the detections.Source: Oasi 2.0 di Gaminara, XNatura platform data as of November 14, 2026
- 27
- Shannon index
- 3.3
- detections per hour
- 8.8
Detections by month
Listen to the latest detectionsLive
The most recent clips arrive live from the site.
Spectrum · pollinators
Pollinators.
Every wingbeat has a frequency. Spectrum measures it and groups it into 19 notes: the more notes appear, the more groups of pollinators visit the site. No cameras, no trapping.
Activity over the season
buzzes per hour of listening · 7-day averageWhen they buzzHow it is calculatedEach cell is an hour of the day in a month: the brighter, the more buzzes. Hours run around the dial (midnight at the top, the site's local time), months go from the centre to the rim. The two light lines are the real sunrise and sunset, day by day. The dashed cell is now. Spectrum sensors listen in daylight hours only.Source: Oasi 2.0 di Gaminara, XNatura platform data as of November 14, 2026
Hours around · months from the centre (March) to the rim (November)
fewer buzzesmore buzzes
In August, the richest month, half of the buzzes fall between 7:00 and 10:52.
The 19 notes
Buzzes by wingbeat frequency
Listen to a note
Camera traps · wildlife
Mammals.
Camera traps film whoever passes, day and night, and a model recognises the species. People are never shown.
The most recent videos arrive live from the site.
The night is theirsHow it is calculatedEach cell is an hour of the day, or a two-hour band when passages are few: the brighter, the more passages of wild species at the camera traps. With few passages the rings are seasons, not months. The two light lines are the real sunrise and sunset; the dashed cell is now. The period starts in March.Source: Oasi 2.0 di Gaminara, XNatura platform data as of November 14, 2026
Hours around · seasons from the centre (spring) to the rim (autumn) · two-hour bands
fewer passagesmore passages
In autumn, the richest season, half of the passages fall between 22:00 and 4:00.
Who passed by
Wild species recognised · passages
- Roe deerCapreolus capreolus141passages
- Wild boarSus scrofa116passages
- Red foxVulpes vulpes61passages
- European badgerMeles meles47passages
- Brown hareLepus europaeus9passages
- Crested porcupineHystrix cristata9passages
Species photos: iNaturalist (Creative Commons licences) and the 3Bee archive.
Reports
From the data to the report.
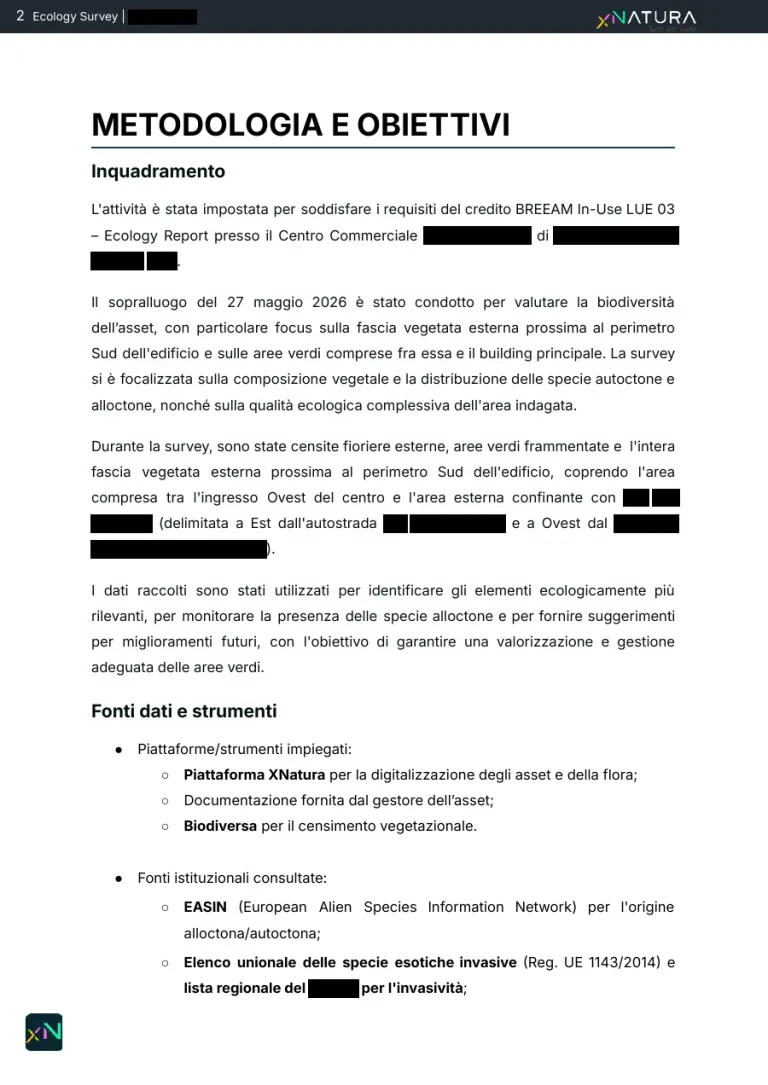
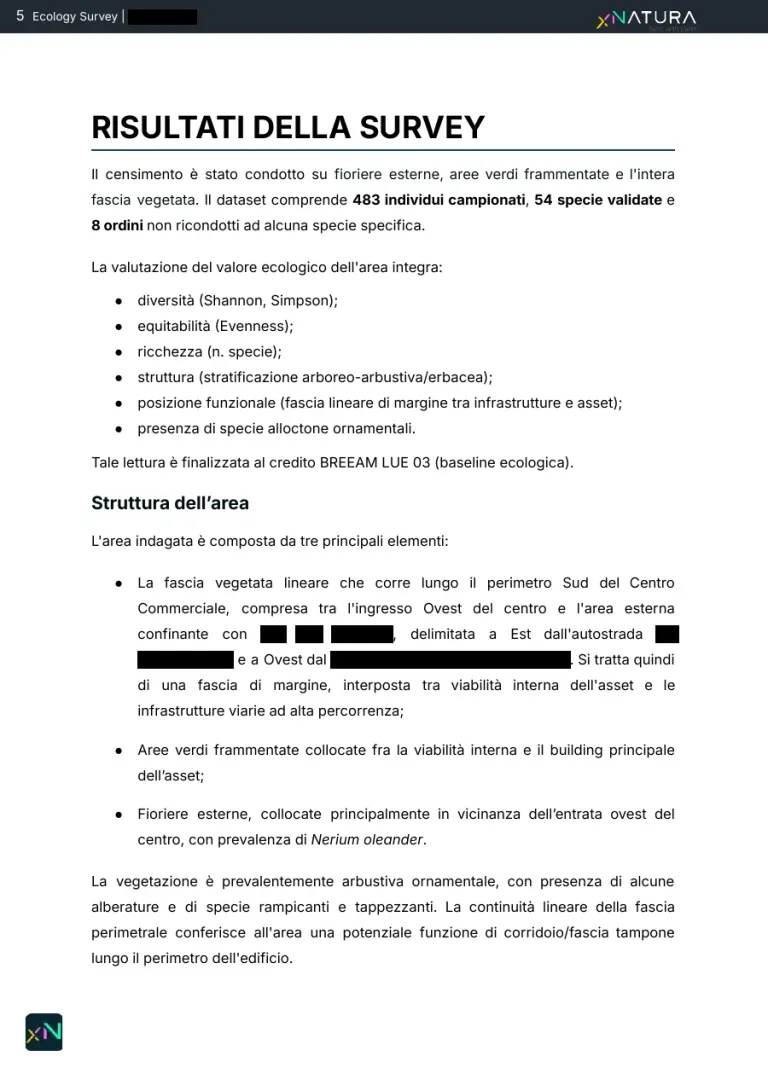
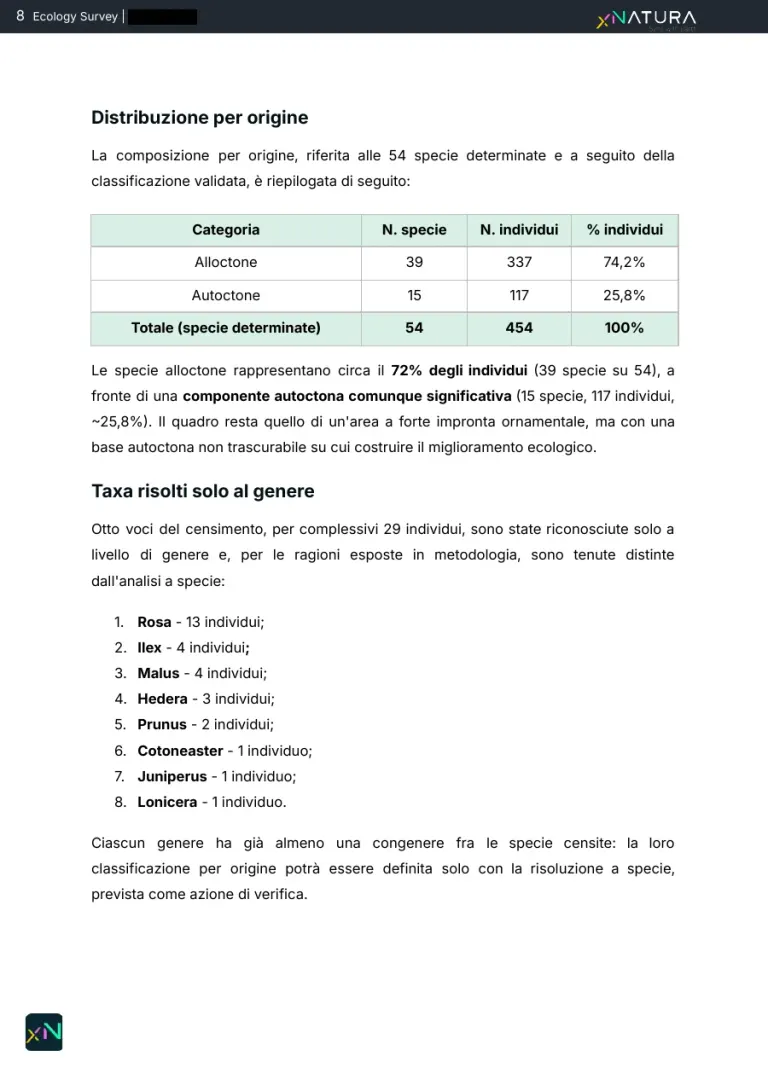
The same readings go into the documents a property needs: the ecology report for BREEAM, the biodiversity baseline, ESRS E4 reporting. These are real pages of one of our BREEAM reports.
Technology
Our sensors.
Wireless and connected over 4G. They are mounted on a post or a tree and transmit on their own.
Inside the sensor
Wildy in 3D, from its design files
This model comes from the CAD files the sensor was engineered with. Turn it, get closer and open it to see where the microphone, the boards and the battery sit.
Loading the 3D model...
Drag to turn, scroll or pinch to zoom.
Parts
From the design
- The model follows today's design: shapes and components may still change.
- The enclosure is made of two halves, front shell and back cover, with a gasket between them.
- Inside are the main board, the modem board with its antennas, the microSD card and the battery; on top, the solar panel on a ball joint.
Model: Wildy v0.17 (STEP)
Wildy, our new sensor: Birdy for birds, Kiro for bats, Spectrum for pollinators, in a single box. Its design is in development.
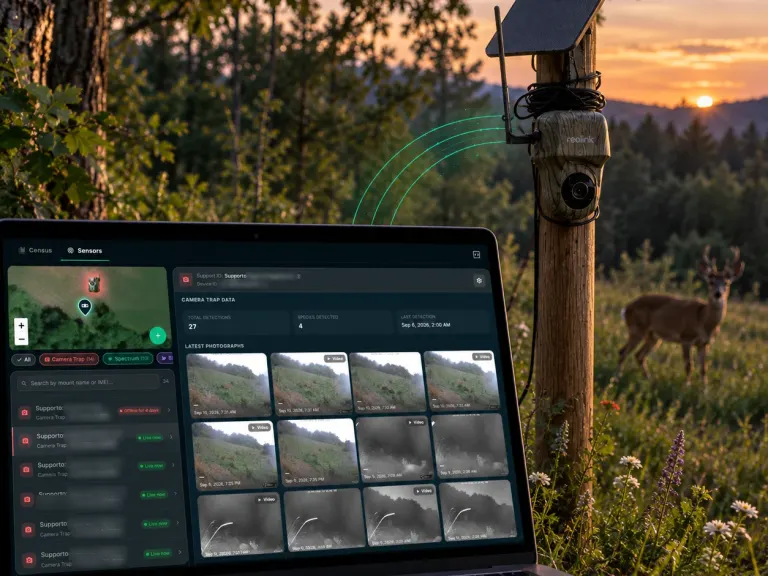
Camera trap
Films the wildlife crossing the site and recognises the species.
Discover the camera trapsPicture these data on your property.
The problem
Certifications, investors and tenants ask what the site does for nature. Photos of the garden are not an answer: what is needed are measurements of the single property, repeated over time.
The solution
The sensors measure all year, the satellite maps cover the boundary and its surroundings, our ecologists sign the report. You have a page to show and the numbers for the questionnaires.
- 01
A live page
The same page you are looking at, with the name of your property: to share with tenants and investors.
- 02
Numbers that hold
Every figure has its clip, its map and its method. It can be heard again and checked again.
- 03
Signed reports
Ecology report and baseline prepared by our ecologists from the measurements.
Want to see it at your address?
Tell us where the property is: we prepare the maps of the site and tell you which sensors it needs. The offer comes from our team.
FAQ
Frequently asked questions
How up to date are the live data of the site?
The sensors transmit several times a day. The page reads the latest detections when you open it and shows how long ago the last reading arrived. Numbers and charts are recalculated every night.
Which sensors does a real estate property need?
It depends on the site: a building with its own green areas usually needs one Birdy and one Spectrum; camera traps are added for larger areas. We decide together after looking at the maps of the site.
Can the live sensor data be used in the reports for real estate certifications?
Yes. The detections go into the ecology report and the biodiversity baseline, which we prepare with our ecologists to the standard required, BREEAM for example.
How do you read the rings of the year in the live data?
The hours of the day run around the dial, with midnight at the top and noon at the bottom. Each ring is a month, from the centre to the rim. The brighter a cell, the more detections in that month at that hour. The two light lines are sunrise and sunset at the site.
Is the site shown live a real site?
Yes: it is Oasi 2.0 di Gaminara, a site followed by 3Bee with Birdy, Spectrum and camera traps in the field. We show it because it has all three families of sensors; the same instruments are installed on the green areas of a property.