






XN Clima · V1 and V2 methodologies

Climate risks: V1 and V2 methodology

Two complementary measures of the same risk: V1 tells you how much of the site's value is exposed to each risk, V2 how much the site can lose on average each year. Pick the one that answers your question and switch between them whenever you want.

In short

V1 and V2: what changes

V1Value at risk

It follows the IPCC climate risk framework: hazard, exposure and vulnerability. For each risk the hazard is a class from A to F, calculated from climate indicators in the IPCC scenarios and, for earthquakes and volcanic eruptions, from geological data; the vulnerability is the sensitivity of the site's production processes, with a damage factor for each class; the exposure is the asset value. The result is the value at risk: the part of the asset value exposed to that risk, in euro. The value at risk of the site is that of the highest risk, earthquakes and volcanic eruptions excluded. Indicators, class thresholds and damage factors of each risk are published in the methodology, with their sources.

V2Expected annual loss

It adds the probabilistic estimate of the loss: for each risk, how much is lost in euro, taking into account how often each event occurs. The expected annual loss is the average of the damage of all possible events, each weighted by its probability. The event loss is the damage of a reference event, for example the 100-year flood.

As in V1, every method is published in the methodology with its sources. Damage to buildings follows damage curves for each type of event (for example JRC for floods, ESRM20 and Hazus for earthquakes, Hazus for wind gusts) or, where the literature is not enough, declared xNatura estimates; damage to production depends on the site's employees (for example the working hours lost to heat, according to the ILO). The sensitivity of the processes comes from ENCORE. The expected loss of the site adds up those of the individual risks without counting the same damage twice; earthquakes and volcanic eruptions are excluded from the total. Where the literature does not yet offer a method for a single site, the risk has its class and an amount of 0 € (an xNatura estimate) or no amount.

They are two different and complementary measures: their figures are not to be compared. The same site can have an exposed value of millions of euro and an expected loss of a few thousand euro per year, because the expected loss takes into account how rarely the most severe events occur.

The classes can differ between V1 and V2: in V2 the class methods use updated indicators and the impact letters use the ENCORE sensitivity. You can switch from one methodology to the other whenever you want: the data of the one you leave stay saved and come back identical.

Side by side

How to read the figures

V1V2
Question it answersHow much of the site's value is exposed to each riskHow much the site can lose on average each year
UnitEuro, exposed valueEuro per year
Frequency of eventsSummarised in the hazard classEach event weighted by its probability
Site totalThe risk with the highest value (earthquakes and volcanic eruptions excluded)The sum of the risks, without double counting (earthquakes and volcanic eruptions excluded)
Typical useRisk prioritisation and materiality analysisEstimate of the annual financial impact

An example

The same site in V1 and in V2

A demonstration industrial site, with an asset value of 10 million euro and 120 employees, seen in both methodologies.

V1Value at risk

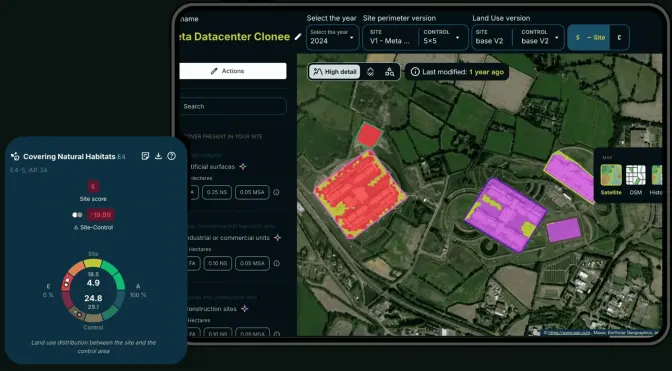
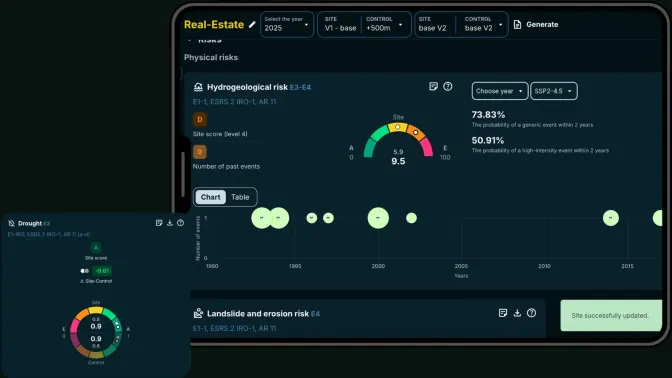
The risks page of the demonstration site in V1, with the banner to switch to V2
Demonstration siteV1
Value at risk of the site
€4,500,000
Main risks, tied
Climate change, Fires, Water stress and Landslides

V2Expected annual loss

The risks page of the same site in V2, with the expected annual loss
Demonstration siteV2
Expected annual loss of the site
€94,259 per year
Costliest risk
Heat stress

Why the figures are so different

V1 answers how much value is exposed: the value at risk is the part of the 10 million euro exposed to the highest risk, according to its hazard class and the sensitivity of the site's processes. V2 answers how much is lost on average in a year: each event weighs by its probability and the most severe events are rare, which is why the expected annual loss is much smaller than the exposed value. They answer two different questions, and what sits at the top changes too: in V1 the value at risk of the site is that of Fires, the highest, and four risks are tied in the highest impact class, E (Climate change, Fires, Water stress and Landslides); in V2 the costliest risk is Heat stress.

Changing methodology

Switching from one methodology to the other

A site has one methodology at a time, and you choose it. You switch from the site's risks page, in both directions.

  1. 01

    From V1 to V2

    On a site in V1 the risks page always shows the banner “Do you want to update the data with the new V2 methodology?”. With “Update to V2” the site moves to V2: if it already has saved V2 values they come back, otherwise every risk of the site is calculated in V2.

  2. 02

    From V2 to V1

    On a site in V2 there is “Back to V1”: the site goes back to its saved V1 values, without a new calculation. If it has none, V1 is calculated from the same data as V2, immediately.

  3. 03

    No data is lost

    The data of the methodology you leave stay saved and come back identical when you return to it. Switching uses no credits, in either direction.

  4. 04

    In reports

    In the Report Builder and in Word templates you choose the methodology, and the report states it: “Risk methodology: V1” or “Risk methodology: V2”.

The switch from V1 to V2 on video

FAQ

Questions on the V1 and V2 methodologies

Do my figures change?

No, not unless you change methodology. A site stays in the methodology it is in: no site moves from V1 to V2, or back, without you asking.

Can I go back to V1?

Yes, always. On a site in V2 there is “Back to V1”: the saved V1 values come back, identical, without a new calculation and without credits.

Which methodology should I use?

It depends on the question you need to answer. V1 for risk prioritisation and materiality analysis: it tells you how much of the site's value is exposed to each risk. V2 for the estimate of the annual financial impact: it tells you how much the site can lose on average each year.

Why can a V2 risk show “n/a”?

Because a figure or a method is missing. Damage to production depends on the site's employees: if they are not entered, the amount reads “n/a (employees not entered)”. And for some risks the literature does not yet offer a method for a single site: the risk has its class but no V2 amount.

Does changing methodology cost credits?

No. Switching from V1 to V2 and back uses no credits, even when the switch needs a new calculation of every risk of the site.

Back to the overview · XN ClimaOverview

Want to see V1 and V2 on your sites? Write to us: we show you both figures and how to read them.

Talk to an expert

Try XNatura on your site

Choose how you prefer. With a new account the first demo is free.