









XN FireSight · Risk maps
Wildfire risk and fuel: the site's maps at 30 metres
One 30 m map shows which parts of a site are most prone to burn, a second which fuel is there. They show neither a fire nor a probability: they tell you where to look first.

The method
Four weighted factors, from satellite sources
The 30 m index is a weighted mean of four factors, with weights set by the AHP method. The site's class starts from ThinkHazard! and counts only where there is a wildland-urban interface.
- 35%
Fuel
The ESA WorldCover land cover classes at 10 m, weighted by flammability after Scott and Burgan.
- 25%
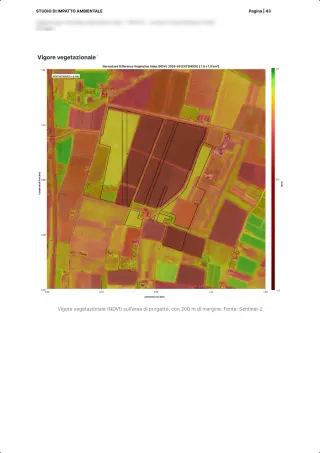
Summer vigour
How green and dense the vegetation is in summer, from Sentinel-2.
- 20%
Aridity
The Global Aridity Index.
- 20%
Surface temperature
Land surface temperature from Landsat 8 and 9.
Sources: Schug et al. 2023, The global wildland-urban interface, Nature · Scott and Burgan 2005, Standard fire behavior fuel models · ThinkHazard! (GFDRR)
On the platform
What is in the maps, and what is not
On the public demo site near Como, 132 hectares: 2.9% of the site in the high class, and 52% of its fuel is woodland. These are the figures of the report you can leaf through on the report page.
What we give
- The 30 m index over the whole site, with the share of each class
- Fuel in five classes: non-burnable, grassland, shrubland, woodland, cropland, also outside Europe
- The wildland-urban interface: natural vegetation within 500 m
- Monthly series of vegetation moisture and vigour (NDMI, NDVI) and land surface temperature
With their limits
- The interface is read on vegetation, not on the density of buildings
- The fuel map stands beside the EFFIS Fuel Type Map, it does not replace it
What the maps do not say
- That a fire will happen, or with which probability
- A loss in euros
- Which areas have already burnt: we do not have a burnt-area layer today
The report
The maps inside the report
In the wildfire risk report on the Como site, the maps sit beside the class, the satellite detections and the climate projections, page by page.
Leaf through the wildfire risk reportFAQ
Questions on the maps
Does the map say where a fire will break out?
No. It shows how prone the land is to burn, from four factors measured by satellite. It is neither a probability nor a forecast.
Does it work outside Europe?
For the fuel, yes: it comes from our land cover and covers any site, while the EFFIS Fuel Type Map covers Europe only and dates from 2017.
What resolution do they have?
The index is at 30 m. The site's class uses ThinkHazard!, a coarser dataset, and counts only where the site lies in a wildland-urban interface.
30 minutes with the team, on XN FireSight.
Video call on Google Meet
Would you rather talk it through?
Either way you are speaking with an AI assistant, and the conversation is transcribed. How we handle your data