









XN Biodiversity · MSA
MSA: how much of the original nature is left, site by site
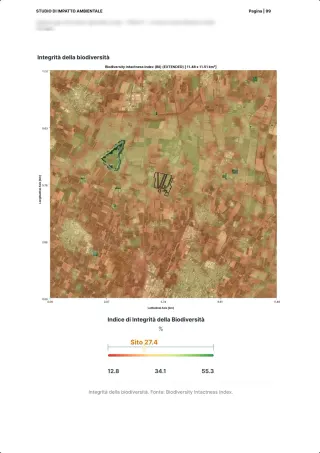
Mean Species Abundance says what share of the original abundance of species remains in an area, from 0 to 100%. We estimate it for every site, split it by cause and compare it with a nearby control area.

The method
An indicator from the scientific literature
MSA is the indicator of the GLOBIO model: it compares the mean abundance of original species with that of an undisturbed ecosystem, where it is 100%. GLOBIO links it to the pressures that lower it, among them land use, fragmentation, infrastructure and climate change. In the platform the site's value is split into the same causes.
- 1
Land use
The value of each land cover class, weighted by its area on the site, for plants and for animals.
- 2
Fragmentation
How far the habitat is broken into small, isolated patches.
- 3
Infrastructure
The disturbance of nearby roads and built works.
- 4
Climate
The effect of climate change on species.
Sources: Alkemade et al. 2009, GLOBIO3, Ecosystems · Schipper et al. 2020, GLOBIO 4, Global Change Biology
In the platform
MSA per site, per cause, against a control area
A number alone says little: a site in town starts low, one in the hills high. That is why every site has its control area, measured the same way.
What we give
- The site's total MSA and its components: land use, fragmentation, infrastructure, climate
- The same calculation on a nearby control area, and the difference between the two
- The loss expressed in hectares, and the MSA map of the site
Alongside
- Field measurements, pollinators and birds, which complete the picture but do not enter the MSA calculation
- Habitats and land use in detail, on which the MSA rests
What MSA does not say
- Which species are there: that takes field surveys and sensors
- Whether a site complies with a rule
- A judgement from a single year: it is read over time, with the same metric
In the case studies
The site and its control area
From the published cases: the AGM Inks oasis near Tornaco, 55.9 against 14.2 for its control area; the A35 Brebemi Treviglio junction, 82.8 against 20.1; the Cubico solar plant at Carlentini, 22.6 against 80.5. The comparison shows where a site adds nature and where it takes it away.
Example reports
See what you receive: real reports, anonymised
Deliverables our experts signed for real clients, with names, places and coordinates removed. Pick one, leave your details and download the PDF straight away.
Your report is ready.
Open it now; a strategist may follow up if it fits a project of yours.
Download the PDF ↓Our systems are temporarily unreachable and the request did not go through. Try again, or write to info@3bee.com.
FAQ
Questions on MSA
Are MSA and biodiversity the same thing?
No. MSA measures how far an area is from an undisturbed state because of human pressures; it does not count the species present. To know which species are there you need field surveys and sensors.
Why a control area?
Because the value depends on the landscape: a site in town starts low, one in the hills high. The comparison with a similar area nearby, measured the same way, tells whether the site does better or worse than its context.
What is MSA used for in the reports?
It is one of the state-of-nature metrics that the reports for ESRS E4 and the TNFD use for each site, together with land use, habitats and field measurements.
30 minutes with the team, on XN Biodiversity.
Video call on Google Meet
Would you rather talk it through?
Either way you are speaking with an AI assistant, and the conversation is transcribed. How we handle your data